Container business consolidation
The second quarter of 2017 and the beginning of the next one will be remembered by the players of the market not only by the launch of the new system of lines of enlarged alliances of carriers, but also by another round of consolidation of the container business.
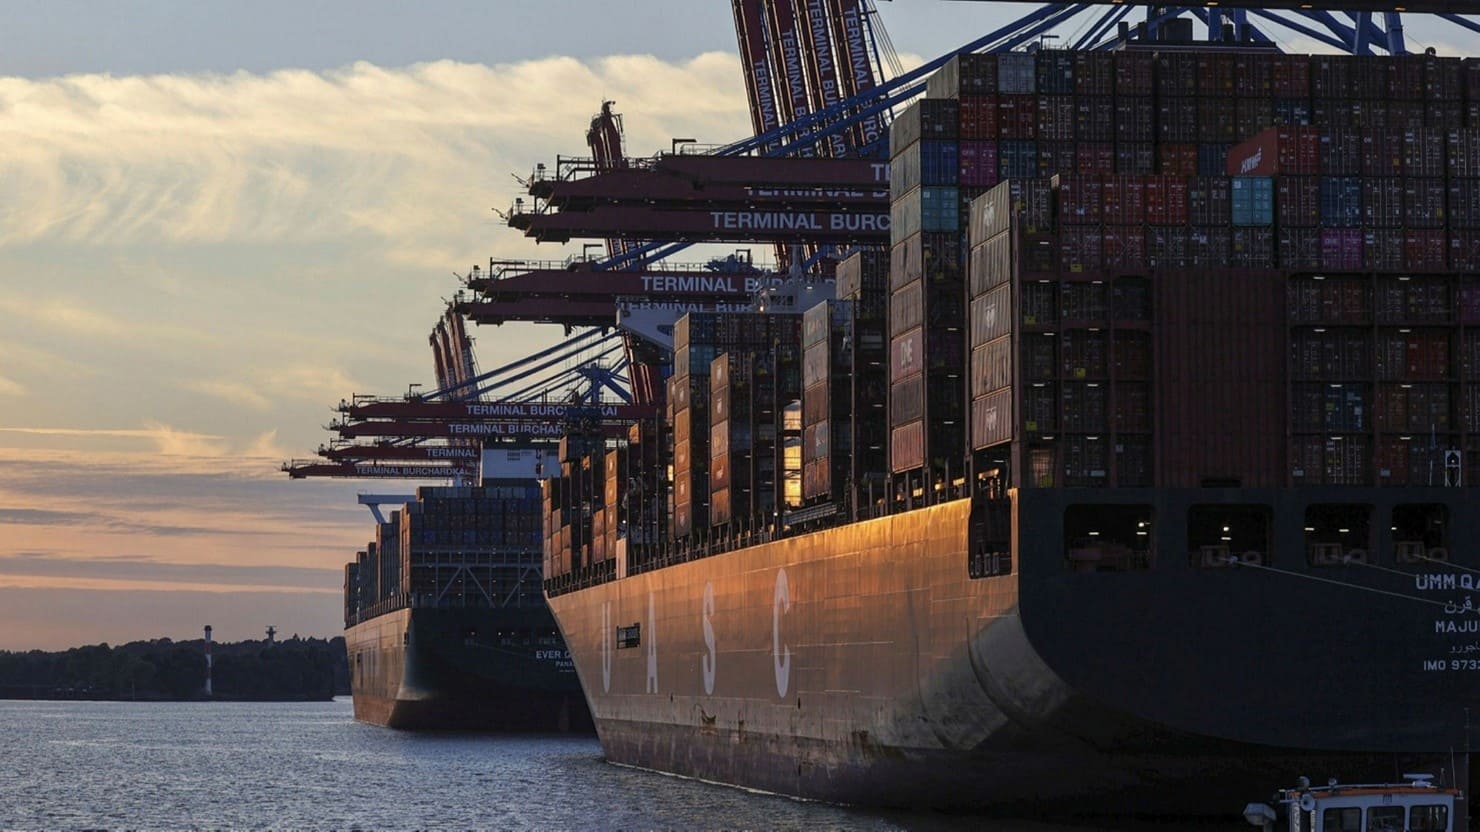
In the period under review, the merger of Hapag-Lloyd and United Arab Shipping Company (UASC) was completed. The unification of 118 Hapag-Lloyd services with 45 services included in the UASC network should be completed by the end of the third quarter of this year. At the same time, the combined fleet of the united company will consist of 230 vessels with an average capacity of 6.84 thousand TEU, and the annual volume of transportation will exceed 10 million TEU.
In April, the agreement on the purchase of the Maersk Line of the German company Hamburg Südamerikanische Dampfschifffahrts-Gesellschaft KG and its brand Hamburg Süd was approved by the boards of directors of Maersk Line and Oetker Group.
The conversations, began in January this year and regularly refuted about the sale of OOCL finally came to the logical conclusion. As it was reported in the joint statement of COSCO Shipping Holdings Co. Ltd. (subsidiary of China COSCO Shipping Corporation Ltd.) and Shanghai International Port Group Co. Ltd. (SIPG), made at the very beginning of July, all holders of the shares of Orient Overseas International Limited (OOIL — owner of OOCL) were offered to redeem all shares of OOIL at a price of HKD 78.67 (totaling US $ 6.3 billion). As a result of the transaction, provided that all holders of OOIL shares sell them, COSCO Shipping Holdings will receive 90.1% of the company’s shares, the SIPG package will be 9.9%. After the merger, the operating fleet of the merged company will be 418 ships with a total capacity of 2.2 million TEU, and the order portfolio — 36 vessels with a total capacity of 698 thousand TEU. The combined company will have 11.5% of the existing capacity of the world container fleet. At the same time, after closing the deal, COSCO Shipping Lines and OOCL will continue to work under their own brand and will remain a member of the Ocean Alliance. The delisting of OOIL is not planned either. An important aspect of the transaction is the terminal business of both carriers, receiving a powerful impetus to increase the influence in a number of ports. At the same time, the price of $ 6.3 billion seems to be overestimated — taking into account its estimated value of $ 4.5 billion. Such a high overpayment (the sale price is set with a premium of 31% to the share price) testifies to the very strong desire of COSCO Shipping to acquire this asset, which is apparently a fundamental step in the implementation of the company’s ambitious plans. There is an opinion that COSCO Shipping will not rest with acquisition of OOCL, which takes the company to the third stage in the rank of world container carriers (from the sixth one — two years ago), but will do its best to reach the first position. To do so, COSCO Shipping, after OOCL, will have to absorb one more independent market player (for example, Pacific International Lines or Evergreen Line). Moreover, the company was interested in acquiring a recently offered for sale by the 24% stake of CMA CGM.
During the period under review, the new joint venture, NYK, MOL and K Line, named Ocean Network Express (ONE), has achieved almost all permits to comply with local competition laws in those regions and countries where it is necessary. The process of obtaining approval from the Republic of South Africa will end before the start of the new company, which is scheduled for April 1, 2018. JV ONE will operate a fleet of 240 ships with a total capacity of 1.42 million TEU — and will take the fifth place in the world market with a share of 6.9-7.5%. We add that the structure of the company-operator Ocean Network Express Pte. Ltd., headquartered in Singapore, will have five regional offices — Ocean Network Express (East Asia) Ltd., headquartered in Hong Kong, Ocean Network Express (Singapore) Ltd., headquartered in Singapore, Ocean Network Express (Europe) Ltd.», headquartered in the United Kingdom, Ocean Network Express (North America) Ltd., headquartered in the United States and Ocean Network Express (Latin America) Ltd. with headquarters in Brazil. The holding company itself is registered in Japan.
According to some analysts, the deal between COSCO Shipping and OOCL could be the last in the current round of consolidation in the industry, and in the long term, the possibility remains only for smaller regional acquisitions. According to the forecasts of another part of analysts, the remaining small operators remained afloat, and are the most likely targets for the next wave of industry consolidation, i.e., the process is not yet complete. Moreover, the opinion is expressed that troubles may also come for CMA CGM, which in time may be pushed from the position of the key player of the Ocean Alliance (especially if COSCO Shipping, after taking over OOCL, will, for example, target PIL or Evergreen, as well as buy out the shares of CMA CGM itself).
In the market there are not many independent medium-sized carriers that control from 1.2% to 4.9% of the global capacity of the container fleet. Among them are Yang Ming, Evergreen, Hyundai Merchant Marine, Pacific International Lines (PIL) and Zim. In fact, these market players have two ways: either to be absorbed by larger competitors, or to find their own regional niche, so far uninteresting to super-powerful players. Analysts of Alphaliner consider the Singapore line of PIL to be the most likely candidate for the next takeover. Thus, taking into account the latest mergers and portfolio of orders for a new building, the share of the first seven players in the container market accounts for 75% of the world’s fleet capacity. And by 2020, no more than six or seven global container carriers will be present on the linear market, compared to 20 — a decade earlier. By 2025 the number of regional (niche) container carriers will decrease substantially.
It’s no secret that the wave of mergers and acquisitions that has literally covered the container industry recently is conditioned by the desire of carriers to reduce unit costs in conditions of increased competition due to the increase in the scale of operations. In addition to saving costs and synergies from mergers, only large players are able to find financing for the order of mega container carriers at a cost of one and a half hundred million US dollars. According to Fitch Ratings, mergers and acquisitions can have a greater healing effect on the market, in comparison with the usual alliances of container carriers. The fact is that alliances have much less ability to structure costs and manage the offered capacity on their services than informal companies.
Container turnover
A significant increase in the container turnover of key port terminals in the first quarter of 2017 prompted a review of their annual growth to 4.6%, compared to the previous forecasts of 2-3%. According to Alphaliner, based on data from more than 150 ports in the world in the first quarter of 2017, growth was 5.8%. At the same time, the bar in 6% exceeded the terminals of Africa, Southeast Asia, Latin America, North America, Northern Europe, and China, including Hong Kong. According to Alphaliner, out of the world’s thirty largest container ports, only six have reduced the volume of transshipment in the first quarter. For the first three months of this year the container turnover of China’s ports grew by 7.3%. The volume of transshipment through the ports of northern Europe grew by 6.6%. According to Japan Maritime Center, the total volume of traffic on the Asia-Europe route for three months was 3.81 million TEU, which is 5.2% more than a year ago. According to the report of Drewry Container Trades Statistics (CTS), in the first quarter of 2017 the volume of global container traffic exceeded 39.5 million TEU. Drewry also notes that the volume of traffic in the first quarter of the year is usually less than in the subsequent ones. The share of the first quarter on average is 23.4% of the annual volume, the second — 25%, and in the third and fourth — more than 25%.
According to preliminary data, the second quarter retained the momentum accumulated in the 1st one, as indicated by the container turnover figures of the world’s leading ports for the first half of this year. Thus, for 6 months traffic through the port of Shanghai amounted to 19.6 million TEU, which is 9.6% more than in the same period last year. Container turnover of the port of Hong Kong (China) in January-June-2017 increased by 10.8%, compared to the corresponding period of 2016 (up to 10.19 million TEU). Container turnover of the port of Rotterdam in the first half of the year increased by 9.3% to 6.7 million TEU. Accordingly, the annual growth in container traffic in 2017 may be adjusted further upwards, surpassing the 5.1% increase that occurred in 2014. This opinion is supported by the APL management, in particular, expecting acceleration of the market growth rates in the second half of the year and strong demand in the peak season, which traditionally falls on the third quarter. Very positive prospects for the growth of world trade and a higher growth rate of container turnover in 2017, compared with last year, are predicted by the ICTSI, operating 30 terminals in twenty countries.
At the same time, as noted by the participants of the TOC Europe Container Supply Chain forum held in Amsterdam, the main container ports of the world may face an investment crisis similar to that which caught up with linear carriers in recent years. In particular, analysts of Sea Intelligence Consulting warned that a large number of already commissioned and still under construction ultra-large container vessels (ULCV) with a capacity of 18-21 thousand TEU will force hub ports, in order to remain competitive, to enter the path of major investment projects, without which it is impossible to effectively handle such vessels, But — without any guarantee of profitability of the investments made. In each region there will be only several hub ports as transshipment centers, because of which the level of competition between ports and terminals will acquire fantastic proportions. As a result, some ports with large container capacities may remain without cargo.
Container turnover of some ports in the world in the first half of 2016 and 2017.
| Port /
country |
Container turnover 1st half of 2017,
Ths TEU |
Container turnover 1st half of 2016,
Ths TEU |
Change (+) (-),
2017/2016, % |
| Shanghai (PRC) | 19600,0 | 17890,0 | +9,6 |
| Singapore | 16150,0 | 15200,0 | +6,3 |
| Hong Kong (PRC) | 10190,0 | 9160,0 | +10,8 |
| Rotterdam (Netherlands) | 6700,0 | 6095,0 | +9,9 |
| Antwerp (Belgium) | 5140,0 | 5047,5 | +1,8 |
| Los Angeles, USA) | 4480,0 | 4130,0 | +8,5 |
| Long Beach (USA) | 3450,0 | 3280,0 | +5,2 |
| Ports of the Russian Federation, incl.
The Baltic basin, Far Eastern Basin Azov-Black Sea basin The Big Port of St. Petersburg |
2260,0
1100,0 683,6 402,5 |
1960,0
1000,0 542,1 343,1 |
+15,3
+10,0 +26,1 +17,3 |
| The Big Port of St. Petersburg | 953,9 | 884,5 | +7,8 |
| Gdansk (Poland) | 689,1 | 645,8 | +6,7 |
| Riga, Latvia) | 208,1 | 182,5 | +14,0 |
| Tallinn (Estonia) | 102,4 | 97,1 | +5,5 |
| Ports of Ukraine | 293,6* | 283,4* | +3,6* |
| — Odessa STP (Ukraine) | 252,6 | 229,9 | +10,0 |
| — Chernomorsk STP (Ukraine) | 8,7 | 13,0 | -33,1 |
| — Yuzhny STP (Ukraine) | 32,4 | 40,5 | -20,0 |
* — without Chernomorsk STP Source: Sea News, PortNews, Infranews
The balance of supply and demand forecasts of market players
According to Alphaliner forecasts, shipments of container tonnage in 2017 will amount to 1.32 million TEU, while 700 thousand TEU can be scrapped. That is net increase of container fleet will be 620 thousand TEU or 3.1%. But this is in case of fulfilling both fundamental parts of the forecast. Meanwhile, according to marine analysts, 75 new container carriers with a total capacity of 540 thousand TEU were commissioned during the first half of the year, while about a hundred fleet units with a total capacity of 310 thousand TEU were used for scrap. That is, the forecast is lagging behind both shipments and the cutting of container ships for scrap. With regard to the second indicator, Affinity Research LLP analysts believe that the volume of container tonnage for scrap in 2017 will not exceed 650 thousand TEU. Therefore, it is possible that the net increase in container tonnage will be slightly higher than predicted (with full execution of the delivery schedule). Nevertheless, taking into account the significant growth rates of container transportation in the first half of 2017, it is very likely that this year the balance between supply and demand will be reached again. For the first time since 2011, this happened in the past 2016, as evidenced by the data of BIMCO / Clarksons. As the forecasts of these sources show, in order to maintain the balance of supply and demand in 2018, it is necessary that the growth of container traffic in this period is not less than 4%, which seems quite achievable. According to the revised IMF forecasts, the world economic growth this year will be 3.6%, compared with 3.1% in 2016, and in the next year — will increase to 3.7%, which should positively affect the market of container tonnage.
However, for the container industry is still too early to rest on its laurels. After all, there is still a huge imbalance of excess capacity, accumulated in previous years — and estimated at 20%. According to Alphaliner, with the launch of the new system of carrier alliances since April 1, 2017, the capacity of the container fleet involved in the services has increased by 5% in comparison with March, and the number of vessels by 4%. It is for this reason that a part of the container fleet — from 500 to 970 thousand TEU, or 2.3 — 4.8% of the current fleet — was constantly at bay for the 2nd quarter. AP Moller Maersk predicts that even in 2022 the tonnage supply in the world market of liner transportation will be about 23 million TEU, while the demand will not exceed 22 million TEU.
Representative deals on sales of container trucks for scrap in Q2 2017
| Vessel name | Construction year | Deadweight/TEU | Price | |
| mln. USD | USD/ LDT | |||
| FRONTIER | 1987 | 13464 | 1,93 | 395 |
| BOMAR RISSEN | 1999 | 23028 | 2,79 | 356 |
| OTTO | 1999 | 25570 | 3,47 | 370 |
| RAJIV GANDHI | 1994 | 28965 | 2,49 | 300 |
| JUIST TRADER | 1998 | 34041 | 3,90 | 375 |
| SANA | 2000 | 41937 | 5,04 | 357 |
| MSC ALICE | 1988 | 43170 | 5,41 | 390 |
| HYUNDAI FREEDOM | 1996 | 68363 | 8,18 | 355 |
| TSING MA BRIDGE | 2002 | 71310 | 9,15 | 390 |
| BOTSWANA | 1998 | 81819 | 10,50 | 398 |
| MOZAMBIQUE | 1998 | 82275 | 11,14 | 398 |
Source: Intermodal
Dynamics of containerized tonnage for scrap in 2012-2017.
| Period | Number of containerships sold, units | Total deadweight,
t |
Average age, years |
| 2012 г. | 176 | 5030944 | 23,46 |
| 2013 г. | 205 | 6788448 | 22,17 |
| 2014 г. | 162 | 5433080 | 22,07 |
| 2015 г. | 92 | 2821898 | 22,17 |
| 2016 г. | 195 | 9000684 | 18,61 |
| 1st half 2017 | 94 | 3718165 | 20,64 |
Source: ALLIED Shipping Research
It is also believed that, at least until the end of this year, operators will not place new large orders for a container new building. The reason is a significant imbalance in supply and demand in the industry, which will continue for several more years, which will lead to a lack of demand for a new tonnage. In June, the global portfolio of orders for container tonnage consisted of 370 ships with a total carrying capacity of about 2.88 million TEU, which is only 14.1% of the current fleet. For comparison, in the peak season of 2007 the value of this indicator reached 64.2%. But the previous minimum was recorded in January 1999 and emounted 14.6%.
With respect to the so-called “peak season” traditionally falling on the third quarter, the opinions of the players of the market were divided. Some believe that since the beginning of the year the situation on the global market has improved noticeably, and this gives reason to expect stronger demand, compared to last year, in the upcoming peak season. On the other hand, for example, DB Schenker, believes that the peak season will be “ordinary”, with the traditional increase in demand for transportation during the period from the second half of July to the end of August. It is also noted that the problems of congestion in the ports of China, primarily in Shanghai, which began in April, are almost completely resolved — and are not expected to occur in the upcoming season of peak demand.
Similarly, opinions were divided on future freight rates. Some analysts do not see any prospects for a full market recovery in the next 18 months, i.e. up to 2019. For example, Fitch Ratings believes that a sustainable recovery in the container transportation market will be achieved only if a stable balance of supply and demand is achieved, which is not currently observed. At the same time, analysts from Changjiang Securities Co. unambiguously say that the massive shipments of mega container carriers have significantly delayed the recovery of the market, which for a few more years is awaiting hard times.
The other part (primarily from shipping circles), including the management of Maersk Line, NYK, MOL and K Line, are confident that their companies will significantly improve their financial performance this year. The same opinion is shared by Drewry analysts who believe that the growth of rates is inevitable — and this is the price that the market will have to pay for years of work at rates below the cost of services, which forced carriers to consolidate. If two years ago there were 16 linear operators operating on the backbone services in the direction of Asia-Northern Europe, now there are only nine (or eight, taking into account the absorption of OOCL). The same applies to another trunk-long tran-Pacific trader: as early as in January 2015, services were supported by more than twenty linear carriers, and now only by 16 (15, taking into account the takeover of OOCL).
The next six months will show which of the forecasts — optimistic or pessimistic — turned out to be more accurate…
Based on materials from the maritime periodicals