Time-charter market
The market of the time-charter container tonnage in the second quarter of 2017 had two opposite trends — increasing during April and lowering during May-June. As a result, the ConTex index, calculated by the Hamburg brokers, which rose to 410 points (+ 7.9%) by the beginning of May, at the end of June fell to 386 points (-5.9%). The BRAEMAR BOX INDEX of London brokers, which grew from 56.2 in early April to 58.9 points in May, was 55.7 points in June, i.е. actually declining in the second quarter. HOWE ROBINSON INDEX, which decreased from 612 to 547 points (-10.6%), and HARPER PETERSEN INDEX, which dropped from 499 to 438 points (-12.2%), decreased even more during the period under review.
Dynamics of the main container indexes in the 2nd quarter of 2017
| Index | Beginning of April | Beginning of May | End of May | End of June |
|---|---|---|---|---|
| BRAEMAR BOX INDEX | 56,2 | 58,8 | 58,9 | 55,7 |
| HOWE ROBINSON INDEX | 612,0 | 642,0 | 608,0 | 547,0 |
| HARPER PETERSEN INDEX | 499,0 | 533,0 | 484,0 | 438,0 |
| A source: BMTI | ||||
| A source: BMTI |
Dynamics of container time-charter rates in the 2nd quarter of 2017, according to Hamburg brokers ConTex
| Container capacity |
04.04.17 | 09.05.17 | 01.06.17 | 29.06.17 |
|---|---|---|---|---|
| TEU | ||||
| 1100 | 6473 | 6619 | 6532 | 6436 |
| 1700 | 7134 | 7507 | 7432 | 7304 |
| 2500 | 8538 | 9426 | 9351 | 8749 |
| 2700 | 8783 | 9623 | 9556 | 9258 |
| 3500 | 8272 | 9480 | 9051 | 8669 |
| 4250 | 9414 | 9903 | 8815 | 7700 |
| ConTex Index | 380 | 410 | 401 | 386 |
| A source: VHSS |
But if in June all the categories of container tonnage had an unambiguously lowering trend, differing only in the rate of fall, then in the three-month section the situation was not so unambiguous. For instance, for the feeder containerships with capacity of 1100 TEU, the rates remained at about the same level, and with capacity of 1700-2500 TEU they grew by 2.4-2.5%. For the containers with capacity of 2700-3500 TEU the rates increased by 400-475 USD / day, or 4.8-5.4%. And for the containerships with capacity of 4250 TEU, on the contrary, collapsed more than 1700 USD / day, or 18.2%.
And if we consider the level of rates that was established by the end of the second quarter of 2017 for the same sizes of container ships with the same period of the last year, an even more interesting situation is observed. For the feeder containerships with capacity of 1100 TEU, the rates decreased by 700 USD / day, or almost by 10%, and with capacity of 1700 TEU they remained virtually unchanged. But for the container ships with capacity of 2500-4250 TEU, they were 2560 — 3050 USD / day higher, or 43.1-54.4%. That is, generally speaking, in the first half of 2017, compared to the same period last year, for most categories of container tonnage, the time-charter market was seriously strengthened, despite the high volatility of rates.
Changes in the annual time-charter rates on a monthly, quarterly and annual basis, according to the Hamburg brokers
| Container capacity | June 2017 | Q2 of 2017 | On annual basis | |||
|---|---|---|---|---|---|---|
| TEU | USD/сут | % | USD/сут | % | USD/сут | % |
| 1100 | -96 | -1,5 | -37 | 0,6 | -703 | -9,8 |
| 1700 | -128 | -1,7 | 170 | +2,4 | -30 | -0,4 |
| 2500 | -602 | -6,4 | 211 | +2,5 | 2635 | +43,1 |
| 2700 | -298 | -3,1 | 475 | +5,4 | 3039 | +49,1 |
| 3500 | -382 | -4,2 | 397 | +4,8 | 3054 | +54,4 |
| 4250 | -1115 | -11,8 | -1714 | -18,2 | 2559 | +51,0 |
| A source: VHSS | ||||||
The jumps in the time-charter rates in the period under review were very impressive for the containerships with capacity of 6000-9000 TEU. For example, if in April Hapag Lloyd took a container ship with capacity of 5,992 TEU for a 4-6 month charter at a rate of 14,000 USD / day, then in June a similar vessel was chartered by Maersk Line at a rate of 10,000 USD / day, or 28.6% lower. The same situation was with the container ship with capacity of 8812 TEU, which Hapag Lloyd chartered for 10-12 months in April at a rate of 20,000 USD / day, while a month and a half later Maersk Line recorded the delivery of four identical vessels for the 2-6 months period at a rate of 14500 USD / day, which is almost a third less.
But the most significant is that Diana Containerships has given the PUELO container ship with capacity of 6541 TEU built in 2006 for a two-month charter to the MOL company at a rate of 14600 USD / day. But before that, this ship was in the freight at MSC at a rate of only 6500 USD / day i.e. 2.25 times lower.
Thus, despite the deterioration of the freight market condition in the container time-charter market in May-June 2017, compared to a year earlier, the rates for the container ships with capacity of more than 2500 TEU remain significantly higher. The reasons for the multidirectional dynamics of time-charter rates in the second quarter of 2017 (growth in April, fall in May-June) are:
- completion of the formation of a new configuration of the system of container alliances and the services they serve;
- a serious reduction in the number of the laid up containership;
- supply of a large number of new container ships
Representative deals for container tonnage in Q2 2017
| Container capacity, TEU | Charter period, month. | Time-charter rate, USD/day | Freighter |
|---|---|---|---|
| 868 | 12 | 5300 | OLDENBURG |
| 1169 | 6 | 7500 | UNKNOWN |
| 1700 | 6 | 9000 | COSCO |
| 1728 | 6 | 6400 | OOCL |
| 1736 | 6 | 7200 | GOLD STAR LINE |
| 1740 | 6 | 7000 | HAPAG LLOYD |
| 1740 | 12 | 7000 | GOTO SHIPPING |
| 2011 | 6 | 7950 | MOLLER MAERSK AS |
| 2466 | 6 | 9650 | X-PRESS FEEDERS |
| 2824 | 6 | 9375 | HAPAG LLOYD |
| 2824 | 6 | 9700 | MILAHA MARITIME |
| 3426 | 3-Feb | 9500 | HAPAG LLOYD |
| 4252 | 1 | 9250 | OOCL |
| 4256 | 6-Feb | 8900 | MAERSK LINE |
| 4957 | 6 | 13750 | ZIM |
| 5992 | 6-Apr | 14000 | HAPAG LLOYD |
| 5992 | 6-Feb | 10000 | MAERSK LINE |
| 6350 | 12 | 10250 | OOCL |
| 6541 | 2 | 14600 | MITSUI O.S.K. LINES |
| 7500 | 6 | 19850 | HAPAG LLOYD |
| 8586 | 6 | 11500 | MAERSK LINE |
| 8814 | 12-Oct | 20000 | HAPAG LLOYD |
| 8814 | 6-Feb | 14500 | MAERSK LINE |
| 9954 | 6 | 33000 | HAPAG LLOYD |
| 11010 | 12 | 18000 | OOCL |
| 11010 | 12 | 18000 | HAPAG LLOYD |
| 11010 | 12 | 18000 | ZIM |
| 13092 | 12 | 28500 | CMA CGM |
| A source: SeaSure |
Linear services
Unlike the time-charter ones, the rates of the linear tariffs have finished the 2nd quarter of 2017 on a rising note, as evidenced by the data of most container freight indexes. Although even here not everything is unambiguous. Thus, the growth of the SCFI index in the last June trading session of the Shanghai Freight Exchange is entirely caused by to the announced by many container lines (just before the peak season) since 01.07.17 the general rate increase (GRI) on the main transportation routes, primarily from Asia to Europe. In addition, some companies directly set peak season surcharges to their tariffs. For example, CMA CGM announced the charging of a peak season surcharge in amount of USD 250 / TEU from 03.07.17 for all the cargo in containers from Asian ports (including Japan, Southeast Asia and Bangladesh) to Northern Europe (including Great Britain, Portugal, Finland And Estonia).
Dynamics of the Shanghai Containerized Freight Index in Q2 2017
| Direction of container transportation | 07.04.17 | 28.04.17 | 19.05.17 | 02.06.17 | 30.06.17 |
|---|---|---|---|---|---|
| Shanghai — Northern Europe (Hamburg, Antwerp, Felixstowe, Le Havre) | 836* | 1021* | 924* | 933* | 1015* |
| Shanghai — the Mediterranean (Barcelona, Valencia, Genoa, Naples) | 817* | 1011* | 914* | 920* | 951* |
| Shanghai — the west coast of the USA (Los Angeles, Long Beach, Auckland) | 1375** | 1606** | 1310** | 1413** | 1378** |
| Shanghai — the easе coast of the United States (New York, Savannah, Norfolk, Charleston) | 2436** | 2625** | 2298** | 2428** | 2356** |
| SCFI Composite index | 809,27 | 909,25 | 830,80 | 894,86 | 918,83 |
| * — USD /TEU; ** — USD /FEU | A source: SSE | ||||
Due to this, the composite index SCFI increased during April-June from 809.27 to 918.83 points, or by 13.5%. Meanwhile, in the direction of Shanghai-Northern Europe, SCFI increased from 836 to 1015 points, or 21.4% and of Shanghai-Mediterranean from 817 to 951 points, or 16.4%. It should be noted that at the end of April, as a result of the GRI taken by container lines, for these two directions the SCFI index has already risen to the figures exceeding 1000 points.
For the North American directions, the SCFI index also showed a certain growth at the end of June, which allowed the direction of Shanghai- US West Coast return to the same level as in early April, while for the one of Shanghai- US East Coast it didn’t work — and at the end of the second quarter, SCFI was 80 USD / FEU, or 3.3%, less than at the beginning of the period under review. But at the end of April, compared to the beginning of the month, the spot rates in the North American directions jumped by 190-220 USD / FEU, or 7.8-16.8%. However, over the next two months, this rise was completely leveled. That is, the spot rates here have dropped almost to the level that occurred last summer before the bankruptcy of Hanjin Shipping, losing all the growth that the lines managed to achieve after this milestone event for the industry.
If talking about the dynamics of spot rates in the second quarter of 2017 — two more points are worth noticing. Firstly, the rates in the direction of Shanghai — South America (Santos) were at the level of 3811 USD / TEU at the end of June, showing a 38 times increase, compared to the middle of February last year, when they were only 99 USD / TEU. And secondly, in the direction of Shanghai-Middle East the spot rates during the second quarter increased from 890 to 910 USD / TEU, or by 2.2%. This suggests that this segment of the market did not suffer in any way from the sanctions imposed by the main Arab countries against Qatar.
Dynamics of the China Containerized Freight Index in Q2 2017 USD/TEU
| Direction of container transportation | 07.04.17 | 28.04.17 | 19.05.17 | 02.06.17 | 30.06.17 |
|---|---|---|---|---|---|
| North European Services | 1044,09 | 1063,61 | 1107,38 | 1099,24 | 1106,70 |
| Mediterranean services | 1010,66 | 1054,65 | 1167,61 | 1178,93 | 1212,66 |
| West American Services | 613,79 | 614,75 | 645,68 | 629,26 | 627,21 |
| East American Services | 861,08 | 847,80 | 854,41 | 853,14 | 823,92 |
| Composite index СCFI | 788,43 | 818,99 | 848,27 | 840,09 | 851,60 |
| A source: SSE |
Compared to the spot ones, the dynamics of the contract rates for container transportation, tracked by the CCFI index, in the second quarter of 2017 was more smooth. During the period under review, the composite CCFI increased from 788.43 to 851.60 points, or by 8.0%. At the same time, for the North European services, the growth of the CCFI was 62.61 points, or 6%, and for the Mediterranean services — 202 points, or 20%. That is, unlike the spot market, the increase in contract rates on Mediterranean services was significantly ahead of the North European ones(the spot rates showed a reverse dynamic). But, the contract rates later than the spot ones respond to the GRI taken by the lines and the introduction of the other mark-ups.
As for the West American and East American services, the situation with the contract rates at the end of June resembled the situation with their spot counterparts. So, for the West American services at the end of the 2nd quarter, CCFI was 13.42 points, or 2.2%, higher than at the beginning of the quarter, and for East American services, on the contrary — 37.16 points, or 4 , 3% lower.
If we compare the average values of the SCFI and CCFI indices, as well as the spot and contract rates on the Nordic and Mediterranean routes in the 1st and 2nd quarters of 2017, it is not difficult to notice their surprisingly high stability, with a takeoff , not exceeding 1-2% in one direction or another.
Average values of the SCFI and СCFI indices in the Q1 and Q2 of 2017.
| Indices | 1 кв. 2017 г. | 2 кв. 2017 г. | Изменения (+)(–), % |
|---|---|---|---|
| Composite index SCFI | 864,64 | 856,05 | -1,0 |
| Including Shanghai – North Europe | 940 | 931 | -1,0 |
| Shanghai — the Mediterranean | 904 | 910 | +0,7 |
| Composite index СCFI | 825,93 | 830,61 | +0,6 |
| Including North European Services | 1106,40 | 1085,51 | -1,9 |
| Mediterranean services | 1101,86 | 1133,94 | +0,7 |
| A source: SSE |
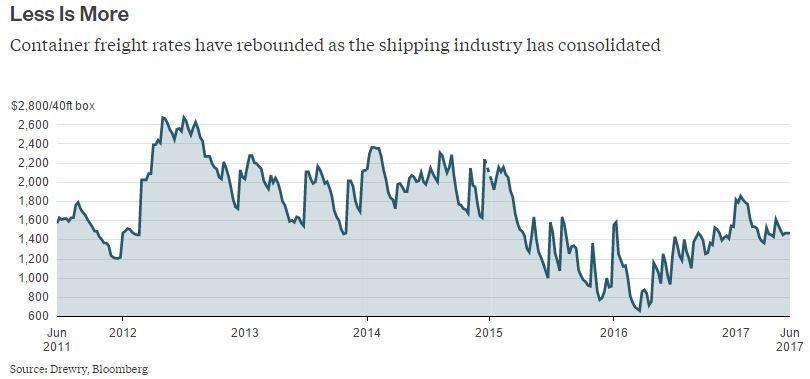
Speaking about the liner transportation, it is necessary to mention another very authoritative world container index — WCI, calculated by the Drewry analysts. During the second quarter of 2017, the WCI composite index declined from 1524 to 1381 USD / FEU, or 9.4%. The average value of the WCI index in the first half of the year was 1552 USD / FEU, which is 127 USD / FEU, or 7.5% lower than the average one for the last 5 years. At the same time, this level is 35% higher than in the first half of 2016, which indicates the strengthening of the freight market this year.
Dynamics of the WCI index in the second quarter of 2017
| Direction | 06.04.17 | 04.05.17 | 01.06.17 | 29.06.17 | 06.07.17 |
|---|---|---|---|---|---|
| Shanghai — Rotterdam | 1676 | 1923 | 1801 | 1652 | 1936 |
| Shanghai — New York | 2617 | 2531 | 2410 | 2017 | 2405 |
| Composite index | 1524 | 1557 | 1467 | 1381 | 1552 |
| A source: Drewry |
For the Shanghai-Rotterdam direction, the WCI index at the end of June was 1652 USD / FEU, which almost coincides with the level that took place in early April this year. But for the direction of Shanghai — New York the WCI during the period under review decreased by 400 points, or 15.3%. Looking ahead, we note that in early July, incorporating the GRI taken by composite lines, the WCI composite index for the Shanghai-New York direction won back the positions lost during the quarter, and for the Shanghai-Rotterdam route even returned to the high level that took place at the end of April this year. And this fact inspires hopes in growth of economy of container transportations in the 3rd quarter of 2017
Dynamics of the World Container Index (WCI) from June 2011 to June 2017.
Сontainer transportation Economy
Data on the results of the work of container carriers in the second quarter are only being taken up and will not be announced earlier than in the second half of August. The only company that made a statement about the results of work for the first half of 2017, is the Chinese COSCO Shipping. According to preliminary data, the company’s profit, according to the results of work during January-June 2017, amounted to 1.85 billion yuan (272 million dollars), compared with 7.2 billion yuan losses in the first half of 2016. As stated by COSCO Shipping, on the stock exchange, the positive changes were the result of the superimposition of two favorable factors — the growth of freight rates and the volume of container transportation, which amounted to 34.72%. It is not ruled out that such a quick sum-up and a loud statement on the Hong Kong Stock Exchange are due to the fact that since May 16, the stock exchange trading in shares of COSCO Shipping (“due to significant uncertainty associated with the upcoming reorganization”) has been suspended. The resumption of trading is possible in case of a certain progress in the asset restructuring process. At the same time, rumors persist across the market that in fact “restructuring” is connected with the firm intention of COSCO Shipping to get OOCL, thereby further strengthening its market position. One way or another, the near future will show. In the meantime, COSCO Shipping added 14 container ships to its order book, in particular six vessels with capacity of 21,000 TEU, with delivery in 2018 — and the cost of one vessel in the range of 157-161 million dollars. Another 8 containerships with capacity of 13,500 TEU, with delivery also in 2018, were purchased from China Shipping Development. These vessels are built on Jiangnan Shanghai Changxing Heavy at a price of 101-104 million dollars. Thus, the total capacity of this fleet is 234 thousand TEU, and the total cost is 1.78 billion US dollars, which represents a considerable amount of investment, even for such a giant as COSCO Shipping.
In May, the results of the 1st quarter of 2017 were published for companies that provide their financial statements. They showed a very ambiguous picture. Among the five companies that had operating profit, this figure ranged from 400 ths (WAN HAI) to $ 252 million (CMA CGM). But the operating losses ranged from 12 million (NYK) to $ 100 million (NMM). The level of profitability at the same time was also in a very wide range — from plus 5.5% to minus 10.4%. According to the analysts of Drewry, such a significant spread of the results indicates the continuing differences between the linear companies in terms of fleet size and their service, the coverage of the market, the customer base, and the differences in the cost structure.
Financial results of the work of the largest container carriers (which submitted their reports) in the 1st quarter of 2017.
| Company | Gross income, million USD | Operating profit, mln USD | Profitability,% |
|---|---|---|---|
| CMA CGM | 4620 | 252 | 5.5 |
| ZIM | 655 | 31 | 4.7 |
| EVERGREEN | 1089 | 21 | 2 |
| HAPAG LLOYD | 2271 | 4 | 0.2 |
| WAN HAI | 447 | 0.4 | 0.1 |
| NYK | 1367 | -12 | -0.9 |
| MAERSK LINE | 5493 | -56 | -1 |
| MOL | 1535 | -59 | -3.9 |
| YANG MING | 974 | -40 | -4.1 |
| K LINE | 1210 | -66 | -5.5 |
| НММ | 962 | -100 | -10.4 |
| A source: Alphaliner |
Considering the operating profitability of the main line carriers, since 2008, the Alphaliner analysts conclude that it had positive values for only 12 quarters, for 7 quarters it was close to zero, while all other periods were negative .
The level of quarterly operating profitability of the main linear carriers from 2008 to 2017
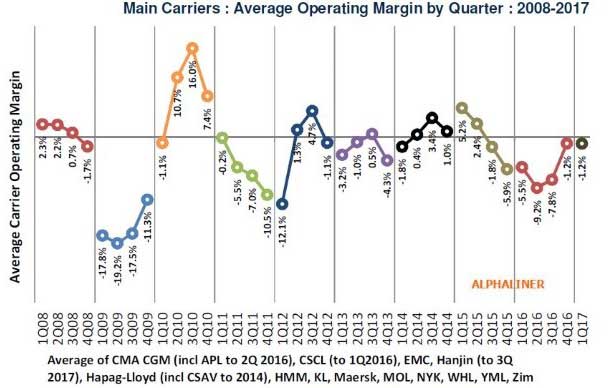
According to the analysts, the radical growth of rates on the main container transportation routes was hampered by severe competition between the line operators, while on secondary routes where the degree of competition was significantly lower, the chances to increase or at least keep the rates at the same level were much bigger.
Dynamics of sales of used container tonnage in 2012-2017.
| Period | Number of containerships sold, units |
Total deadweight, t | Average age years |
Total cost of sales, Mln. USD |
|---|---|---|---|---|
| 2012 г. | 139 | 3262603 | 15 | 1022,4 |
| 2013 г. | 180 | 5304442 | 12 | 1840,7 |
| 2014 г. | 182 | 6944855 | 11 | 1862,9 |
| 2015 г. | 219 | 7640657 | 12 | 2724,4 |
| 2016 г. | 113 | 4426131 | 11 | 1157,3 |
| 1 п/г 2017 г. | 145 | 6573792 | 11 | 1075,6 |
| A source: ALLIED Shipping Research |
Quite active the first half of 2017 was in terms of changing the owners of the used tonnage. If for the whole 2016, 113 container carriers with total deadweight of 4.4 million tons found their new owners, then in the first half of 2017 these figures have already grown to 145 vessels with total deadweight of 6.6 million tons. Such a sharp activation, first of all , is due to the sale of the fleet of Hanjin Shipping which became bankrupt at the end of August last year.
Representative deals for the sale of container tonnage in Q2 2017
| Vessel name | Construction year | Container сapacity, TEU | Price, mln. USD | ||
|---|---|---|---|---|---|
| JRS CANIS | 2006 | 698 | 3,20/2,40* | ||
| CONTRAIL SKY | 2009 | 907 | 6,50/6,70* | ||
| HOHEPLATE | 2007 | 957 | 4,80 | ||
| HOHEFELS | 2008 | 957 | 4,80 | ||
| SARA | 2006 | 1049 | 8,20 | ||
| EVIDENCE | 1997 | 1050 | 1,20 | ||
| CONRAD S | 2006 | 1118 | 5,50 | ||
| MAREN S | 2005 | 1118 | 3,90 | ||
| SHIPPAN ISLAND | 2005 | 1118 | 5,50/5,20* | ||
| MARE FRIO | 2003 | 1221 | 5,30/2,80* | ||
| KUO WEI | 1997 | 1367 | 3,30/2,70* | ||
| KMTC INCHEON | 1998 | 1675 | 4,50 | ||
| BERMUDIAN EXPRESS | 2000 | 1679 | 3,80 | ||
| CREMON | 2000 | 1679 | 3,80 | ||
| SUNSHINE BANDAMA | 2007 | 1700 | 9,00/8,90* | ||
| HS SMETANA | 2006 | 1740 | 7,40/6,50* | ||
| DAE SUN 606 | 2017 | 1785 | 20,40 | ||
| BF IPANEMA | 2009 | 1794 | 8,20/7,90* | ||
| AJA IPSA | 2004 | 1858 | 5,30/4,90* | ||
| CONTI ELEKTRA | 2007 | 2127 | 5,80 | ||
| WEHR OSTE | 2002 | 2524 | 3,90 | ||
| AROSIA | 2006 | 2732 | 10,20/9,20* | ||
| CAPE MELVILLE | 2005 | 2741 | 7,85/7,00* | ||
| CAPE MORETON | 2005 | 2741 | 7,85/7,10* | ||
| STADT DRESDEN | 2006 | 2742 | 7,80/8,40* | ||
| TAROKO | 2003 | 2754 | 12,20 | ||
| TASANEE | 2002 | 2824 | en bloc | ||
| HAMMONIA ANTOFAGASTA | 2008 | 2797 | 8,90/9,70* | ||
| CARPATHIA | 2003 | 2824 | 19,20 | ||
| CARDONIA | 2003 | 2824 | en bloc | ||
| CIMBRIA | 2002 | 2824 | |||
| CARPATHIA | 2003 | 2824 | 6,40/6,40* | ||
| CORDELIA | 2003 | 2824 | 6,10/6,20* | ||
| BOX TRADER | 2010 | 3426 | 23,00 | ||
| BOX VOYAGER | 2010 | 3426 | en bloc | ||
| HS HAYDN | 2010 | 3534 | 8,50/5,50* | ||
| DOUKATO | 2002 | 3739 | 6,15/5,70* | ||
| RIO CHARLESTON | 2008 | 4300 | 10,60/7,20* | ||
| BARBADOS | 2010 | 4360 | 9,50/7,50* | ||
| SCT DISTINCTION | 2010 | 4380 | 9,20 | ||
| HS EVEREST | 2014 | 4771 | 20,00 | ||
| HS MARCO POLO | 2014 | 4771 | 20,00 | ||
| SCT QATAR | 2010 | 4963 | 9,60/9,60* | ||
| SCT OMAN | 2010 | 4963 | 9,60/9,40* | ||
| NANSEN STRAIT | 2005 | 5047 | 7,60/7,50* | ||
| MAULE | 2010 | 6589 | 20,00 | ||
| CONTI VANCOUVER | 2005 | 7471 | 14,00/11,80* | ||
| E.R. TIANAN | 2005 | 8533 | 26,00 | ||
| LLOYD PARSIFAL | 2006 | 8533 | 26,50 | ||
| HANJIN HAMBURG** | 2011 | 8586 | 25,00/29,90* | ||
| HANJIN NEW YORK** | 2011 | 8586 | 25,00/29,70* | ||
| * – Vesselvalue.com ** – Bank Sale | A source: Intermodal, SeaSure | ||||
Here it should be noted that the second quarter of 2017 didn’t go without a loud bankruptcy as well. This time the Rickmers Holding AG company fell, after the main creditor (HSH Nordbank) denied Rickmers a loan, did not agree on the terms of the restructuring and refused further negotiations on restructuring. We add that Rickmers Group, as for the end of 2015, managed a fleet of about 130 vessels.
At the end of the economic section, let us recall that most analysts consider 2017 in terms of financial results of the operation of container lines to be much more successful than 2016, when the industry received a total loss of $ 3.5 billion. But in many respects this will depend not only on the level of freight rates, but also on the lines of work on reducing own costs and optimizing the operation of container services. Speaking about the economy of container business, we will also note that it is influenced by such difficult factors as cybersecurity of carriers. Thus, the attack of the computer virus “Petya A.” at the end of June this year. Blocked the bookings of cargo and stopped the work of a number of Maersk Line terminals, causing serious damage to the company’s business. It took at least a week to correct the situation. And more, to enhance cybersecurity, in order to prevent the repetition of such a situation, additional costs will be required and obviously considerable ones.
Service modernization
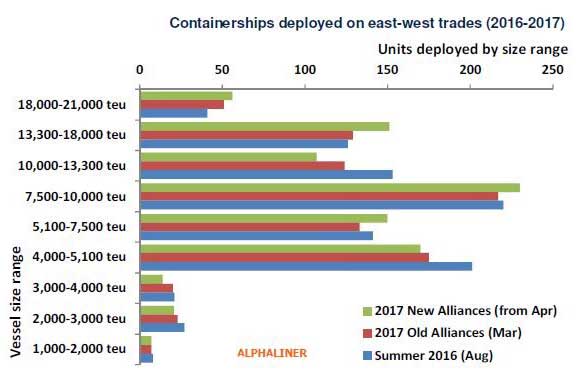
The main event of the second quarter of 2017 was the beginning of work from April 1 of the new system of alliances of container carriers. The first thing that catches the eye when considering the composition of the fleet used by the new configuration of alliances is a sharp increase in the share of vessels with capacity of more than 13,000 TEU.
Number and capacity of containerships involved in the alliances in the old (before April 2017) and new (from April 2017) configurations
| Container capacity, TEU | Number of vessels, units | ||
|---|---|---|---|
| From April 2017. | In March 2017. | In August 2016. | |
| 1000-2000 | 7 | 7 | 8 |
| 2000-3000 | 22 | 23 | 27 |
| 3000-4000 | 14 | 20 | 21 |
| 4000-5100 | 170 | 175 | 201 |
| 5100-7500 | 156 | 133 | 141 |
| 7500-10000 | 230 | 217 | 220 |
| 10000-13300 | 107 | 124 | 153 |
| 13300-18000 | 151 | 129 | 126 |
| 18000-21000 | 56 | 51 | 41 |
| Total fleet capacity, million TEU | 8,37 | 7,94 | 8,24 |
| A source: Alphaliner | |||
The distribution of the capacity of containerships used in services in the new and old alliance systems in 2016 — 2017.
It should also be noted that the formation of a new service system, like any other new organizational undertaking, was not all nice and clean. The movement of the ships’ work to new services according to changed schedules, often with calls to other container hubs, turned out to be a bit more complicated than previously thought. And at first it often led to the “organized chaos”, consisting of the stalls of container ships, violations of the announced schedule and delays in the export of containers from terminals. But we can say that all these difficulties were successfully overcome and the new system works almost without failures (we already mentioned the virus “Petya A.”).
But life does not stand still and the factors of supply and demand, plus the desire for optimization, constantly make their own adjustments. Therefore, the CMA CGM company, together with its partners in the Ocean Alliance, since July this year instead of the previously used services, MEGEM and MEDEX opens a new INDIAMED service, which has the following rotation of the ports of call: Khorfakkan — Karachi — Nhava Sheva — Mundra — Djibouti — Jeddah — Damietta — Piraeus — Malta — Alaga — Mersin — Port Said — Khorfakkan.
Even earlier, in April this year OOCL opened a new weekly service NORTH EUROPE — TURKEY (NET), serviced by four container ships along the route: Felixstowe — Hamburg — Antwerp — Piraeus — Istanbul (Kumport) — Izmit — Izmir — Salerno — Felixstowe. In addition, in May, due to expected low demand in South Korea, China and the Eastern Mediterranean, OOCL canceled the flight on the Asia — East Mediterranean and Black Sea (EM1) service. In the west direction, the flight that was due to start from May 7 from Busan, and in the east direction from June 9 from Izmit were canceled. Recall that since April this year, the following rotation of the ports of call on the EM1 service has taken place: Busan — Shanghai — Ningbo — Kaohsiung — Shekou — Singapore — Port Said — Beirut — Piraeus — Istanbul (Eviap) — Istanbul (Ambarli) — Constanta — Odessa — Istanbul (Ambarli) — Iskenderun — Port Said — Port Kelang — Busan.
In May, ZIM company updated its Greece Turkey Service (TGX) by placing three container ships with capacity of 1700 TEU with the following rotation of ports of call: Haifa — Ashdod — Antalya — Istanbul — Izmit — Gemlik — Istanbul — Piraeus — Thessaloniki — Izmir — Haifa. At the same time, the calls to Haifa and Ashdod are made on fixed days of the week.
From May 6, as a result of the agreement on the use of slots concluded between Arkas Line and EMES Feedering, a new weekly Black Sea Med Service (BMX) was launched, serviced by two container ships with capacity of 1700 TEU each. The rotation of the ports of call of BMX: Piraeus — Istanbul — Novorossiysk — Odessa — Constanta — Istanbul — Piraeus. Prior to that, the Arkas Line company worked for Novorossiysk as part of a joint service with Seago Line (a subsidiary of Maersk Line).
From June 21, the Unifeeder company changed the schedule of its service connecting the ports of Russia, Finland, Poland and Great Britain. The container ships working on this service on the fixed days of the week go to the following ports: St. Petersburg — Kotka — Gdynia — Immingem. In addition, at the end of June, Unifeeder supplied an additional vessel for service between the ports of Lithuania, Poland and the UK, visiting them twice a week. Rotation includes the following ports: Klaipeda — Gdynia — Szczecin — Immingham — Gul — Rotterdam.
Thus, the work on updating, optimization and modernization of services is a constantly ongoing process designed to create a more perfect system and, on the one hand, to take into account the interests and needs of the client; on the other hand, to minimize the costs of the linear operators.