V.Voynichenko
Freight observer, Ph.D.
Time-charter market
The final 4 th quarter of 2017 in the market of time-charter container tonnage is characterized by enviable stability with a slight upward trend for container ships with capacity of 1100-2500 TEU and 3500 TEU. In any case, this is the picture given by ConTex index, calculated by Hamburg brokers. ConTex index, which was 401 in early October, remained at the same level until the beginning of December and completed 2017 at around 404 points.
Dynamics of container time-charter rates in the 4th quarter of 2017 according to the estimates of Hamburg brokers ConTex
USD/day
| Container capacity,TEU | 05.10.17 | 26.10.17 | 30.11.17 | 21.12.17 |
| 1100 | 6666 | 6778 | 6730 | 6772 |
| 1700 | 8104 | 8423 | 8729 | 8817 |
| 2500 | 8815 | 8823 | 8876 | 9008 |
| 2700 | 9349 | 9357 | 9270 | 9131 |
| 3500 | 8371 | 8300 | 8335 | 8423 |
| 4250 | 8842 | 8157 | 7676 | 7895 |
| ConTex index | 401 | 401 | 401 | 404 |
Source: VHSS
Change in the rates of annual time-charters in the quarterly and annual cuts according to the estimates of Hamburg brokers
| Container capacity,
TEU |
Q4 2017 | Annually | ||
| USD/сут. | % | USD/сут. | % | |
| 1100 | +106 | +1,6 | +701 | +11,5 |
| 1700 | +713 | +8,8 | +2420 | +37,8 |
| 2500 | +193 | +2,2 | +3461 | +62,4 |
| 2700 | -218 | -2,3 | +3168 | +53,1 |
| 3500 | +52 | +0,6 | +3104 | +58,4 |
| 4250 | -947 | -10,7 | +3749 | +90,4 |
Source: VHSS
The annual time charter rate for container ships with capacity of 1100 TEU for the period under review has grown by a little more than 100 USD / day or by 1.6%. The increase in rates for feeder container ships with capacity of 1700 TEU, was much more noticeable — more than 700 USD / day, or 8.8%. The dynamics of rates for container ships with capacity of 2500 and 2700 TEU in the 4th quarter of 2017 was multidirectional, and if rates for the first category of vessels increased by almost 200 USD / day or 2.2%, then for the second category they decreased by almost the same amount. In fact, at the same level, throughout the quarter, there were rates for container ships with capacity of 3,500 TEU, showing an increase of only 0.6%. But the rates of the annual time charter for container ships of the Panamax class with capacity of 4250 TEU in the period under review showed a significant drop, falling by almost 1000 USD / day or 10.7%. True, the comparison of rates in the annual section shows that, compared to the end of 2016, this category of container carriers has the maximum increase in earnings, which amounted to 3750 USD / day or 90.4%. That is, despite the fall in the 4th quarter of 2017, rates for container ships with capacity of 4250 TEU still remain almost twice as high as a year earlier. For container ships with capacity of 2500-3500 TEU, this gap is 2420-3460 USD / day, which is 1.53-1.62 times higher than the level of the end of the last year.
For feeder containerships with capacity of 1700 TEU, the increase is 2420 USD / day or 37.8%, and 1100 TEU — 700 USD / day or 11.5%. Thus, the larger the size of container ships, the more noticeable is the annual increase in time-charter rates. Recall that at the end of 2016 the composite index ConTex, was only 293 points, i.е. was more than a third lower.
Dynamics of the main container indices in the 4th quarter of 2017
| Index | Early October
2017 |
Early November
2017 |
Early December
2017 |
Late December
2017 |
| BRAEMAR BOX INDEX | 59,9 | 59,2 | 60,6 | 61,9 |
| HOWE ROBINSON INDEX | 634,0 | 588,0 | 593,0 | 599,0 |
| HARPER PETERSEN INDEX | 508,0 | 474,0 | 477,0 | 483,0 |
Source: BMTI
Calculated by London brokers BRAEMAR BOX INDEX during the 4th quarter of 2017 increased from 59.9 to 61.9 points or by 3.3%, i.е. showed more significant strengthening than ConTex (+ 0.7%). But two more representative container indexes HOWE ROBINSON INDEX and HARPER PETERSEN INDEX in the period under review showed a negative dynamics, declining by 4.9 — 5.5%. The fall in the level of these indexes applies exclusively to October of this year, since in November-December both indexes began a gradual recovery.
But in any case, no matter what dynamics an index showed, it should be noted that at the end of 2017 there was a noticeable strengthening of the tone of the time-charter container tonnage market, especially in comparison with the same period last year. As an illustrative example, we can cite two transactions for chartering Diana Containership ships of Wan Hai Lines, concluded in late 2017. Thus, the HAMBURG container ship with capacity of 6494 TEU built in 2009 was chartered for a period of 120-220 days at a rate of 11000 USD / day, and the same vessel ROTTERDAM for the period of 120-170 days — at a rate of 13150 USD / day. Prior to that, both vessels were in a charter period of CMA CGM at rates of 6700 and 6890 USD / day respectively. Thus, the growth rate for new charter was 64.2-90.1%.
Representative deals on container tonnage in the 4th quarter of 2017
| Container Capacity,
TEU |
The period of chartering,
months |
Time-charter rate, USD / day. | Charterer |
| 1118 | 9 | 6500 | MOLLER MAERSK AS |
| 1452 | 6 | 7000 | MCC TRANSPORT |
| 1700 | 6 | 8500 | TS LINES |
| 1700 | 9 | 9900 | MCC TRANSPORT |
| 1730 | 6 | 8000 | X-PRESS FEEDERS |
| 1740 | 6 | 8000 | HAPAG LLOYD |
| 1756 | 6 | 10100 | OOCL |
| 1900 | 6 | 10800 | COSCO SHIPPING |
| 2190 | 6 | 11000 | MAERSK LINE |
| 2190 | 6 | 12025 | FAR SHIPPING |
| 2268 | 12 | 12500 | MCC TRANSPORT |
| 2478 | 6 | 8250 | MOLLER MAERSK AS |
| 2496 | 6 | 8500 | MOLLER MAERSK AS |
| 2506 | 12 | 8500 | HAMBURG SUD |
| 2564 | 6 | 9100 | X-PRESS FEEDERS |
| 2582 | 6 | 9100 | HAMBURG SUD |
| 2702 | 6 | 9500 | WAN HAI LINES |
| 2702 | 6 | 9500 | OOCL |
| 2800 | 6 | 9350 | SIMATECH SHIPPING |
| 2800 | 6 | 9150 | CMA CGM |
| 2824 | 6 | 9000 | MOLLER MAERSK AS |
| 2824 | 6 | 9000 | OOCL |
| 3534 | 12 | 7500 | MCC TRANSPORT |
| 4255 | 6 | 8500 | COSCO |
| 4957 | 6 | 12250 | RCL |
| 5468 | 6 | 12500 | MOLLER MAERSK AS |
| 6402 | 6 | 13400 | NYK LINE |
| 6900 | 6 | 15550 | NYK LINE |
Source: SeaSure
Linear transportation
It is very difficult to give an unambiguous assessment to the market of liner transportation in the 4th quarter of 2017. The beginning of the quarter coincided with the end of the peak season and the decline in business activity due to the long celebration of the Independence Day of China. As a result, the SCFI index for spot rates, calculated by the Shanghai Freight Exchange (SSE), dropped to 724.93 points, which is the minimum value of this indicator in 2017.
Dynamics of the Shanghai Containerized Freight Index in Q4 2017
| Direction of container transportation | 13.10.17 | 03.11.17 | 01.12.17 | 29.12.17 |
| Shanghai — Northern Europe (Hamburg, Antwerp, Felixstowe, Le Havre) | 686* | 779* | 729* | 864* |
| Shanghai — the Mediterranean (Barcelona, Valencia, Genoa, Naples) | 652* | 660* | 598* | 738* |
| Shanghai — the western coast of the USA (Los Angeles, Long Beach, Auckland) | 1367** | 1548** | 1177** | 1523** |
| Shanghai — the eastern coast of the USA (New York, Savannah, Norfolk, Charleston) | 1801** | 2089** | 1901** | 2418** |
| Composite index SCFI | 724,93 | 818,73 | 732,04 | 824,18 |
* — USD /TEU; ** — USD /FEU Source: SSE
Spot rates in the direction of Shanghai — Northern Europe decreased to 686 USD / TEU, and to the Mediterranean Sea — to 652 USD / TEU. In the direction of Shanghai – Western US coast the rates fell to 1367 USD / FEU, on the eastern coast of the USA — up to 1801 USD / FEU. And, although at the end of December, spot rates on the North European and Mediterranean services were 86-178 USD / TEU (+ 13.1-25.9%) higher than in October, do not forget that in early December, direction Shanghai — the Mediterranean crashed to less than 600 USD / TEU, which was not observed since 2016. The same applies to North American services, where the rate increase at the end of December compared to the beginning of the quarter was 156-617 USD / FEU (+ 11.4-34.3%), but in early December, rates in the direction of Shanghai-Western coast of the USA fell to 1177 USD / FEU. And that is despite the regular attempts of the lines to raise rates by announcing general rate increases (GRI), as well as the cancellation of individual flights due to the end of the peak season, etc. But all these measures brought only temporary success. And although the composite index SCFI in late December was almost 100 points or 13.7% higher than at the beginning of the quarter, the average value of the SCFI index in the 4th quarter was only 752.47 points, i.е. was noticeably lower than in the previous three quarters of 2017. At the same time, the average level of spot rates in the direction of Shanghai — Northern Europe dropped to 746 USD / TEU, and to the Mediterranean Sea in general to 628 USD / TEU, which is by 15.0 — 22 , 6% less than in the third quarter of 2017
Average values of the SCFI index for the 2017
| Indices | Q1
2017 |
Q2
2017 |
Q3
2017 |
Q4
2017. |
| Composite index SCFI | 864,64 | 856,05 | 828,74 | 752,47 |
| including Shanghai — Northern Europe | 940 | 931 | 878 | 746 |
| Shanghai — the Mediterranean | 904 | 910 | 811 | 628 |
Source: SSE
No less volatility than in case with SCFI in the 4th quarter of 2017 was shown by the calculated Drewry World Container Index (WCI). So, for the direction of Shanghai-Rotterdam, the values of the WCI index fluctuated in the range 1252-1716 USD / FEU, and in the direction of Shanghai-New York — 1789-2404 USD / FEU, i.e. the difference in rates reached 34-37%. In general, the composite WCI index for the fourth quarter decreased by 96.85 points or 7.5%.
Dynamics of the WCI index in the 4th quarter of 2017
USD/FEU
| Directions | 05.10.17 | 26.10.17 | 02.11.17 | 30.11.17 | 21.12.17 |
| Shanghai -Rotterdam | 1325 | 1252 | 1716 | 1304 | 1494 |
| Shanghai — New York | 2003 | 1789 | 2404 | 1820 | 1880 |
| Composite index | 1292,06 | 1207,46 | 1517,10 | 1147,47 | 1195,21 |
Source: Drewry
Unlike the SCFI and WCI indices, the SSE calculated yet another container index — СCFI, which already for contract rates, showed rare stability in most of the directions in the 4th quarter of 2017. Composite index СCFI during the considered period fluctuated in the range of 770.64-779.47 points, i.е. with deviations not more than 1.1%. At the end of December, the level of the CFI index for the North European destinations was 2.7% higher than at the beginning of the fourth quarter, while for West American and East American services there was a decline in the range of 1.4-1, 9%. But the most significant decline in the index of the CFI — from 976.25 to 861.70 points or 11.7% — in the period under review occurred on the Mediterranean services. The average level of the СCFI index for the Mediterranean services in the fourth quarter of 2017 was 906.03 points, which is 22.9% inferior to the indicator of the 3rd quarter, while the composite index of the СCFI fell only by 9.4%.
Dynamics of the China Containerized Freight Index in Q4 2017
USD/TEU
| Direction of container transportation | 13.10.17 | 03.11.17 | 01.12.17 | 29.12.17 |
| North European Services | 1013,83 | 1002,64 | 1006,12 | 1040,72 |
| Mediterranean services | 976,25 | 918,95 | 877,58 | 861,70 |
| Western American Services | 614,64 | 627,24 | 613,97 | 606,28 |
| East American Services | 795,58 | 772,24 | 770,01 | 780,78 |
| Composite index СCFI | 772,65 | 779,47 | 772,77 | 770,64 |
Source: SSE
Average values of the СCFI index in 2017
| Indices | Q1
2017 |
Q2
2017 |
Q3
2017 |
Q4
2017 |
| Composite index of СCFI | 825,93 | 830,61 | 846,04 | 774,89 |
| including Northern European services | 1106,40 | 1085,51 | 1124,49 | 1015,94 |
| Mediterranean services | 1101,86 | 1133,94 | 1175,60 | 906,03 |
Source: SSE
The average values of the SCFI and CFI indices in 2016-2017
| Indices | 2016 г. | 2017 г. |
| SCFI | 581,69 | 826,91 |
| including Shanghai — Northern Europe | 687,17 | 876,05 |
| СCFI | 711,71 | 820,24 |
Source: SSE
Thus, the average values of both the SCFI index and the CFI index in the 4th quarter were inferior to those of the previous three quarters of 2017. However, compared to the failed 2016, the average value of the SCFI index in 2017 increased by 245.22 points or 42.2% (including in the direction of Shanghai-North Europe — by 189.08 points or 27.5%) , and the index of the CFI — by 108.53 points or 15.2%. Xeneta analysts note that despite the fall in rates in the 4th quarter of 2017, their level in the contracts concluded for 2018, although below the peak values of the year ended, is still substantially higher than the level that took place in 2016.
As for the Drewry WCI index, it should be noted that its average value in 2017 was 1461 USD / FEU, which is 132 USD / FEU or 8.3% less than the average for the five-year period. Moreover, the value of the WCI index at the end of 2017 was 23% lower than at the end of 2016.
Dynamics of the World Container Index from December 2015 to December 2017
USD/FEU
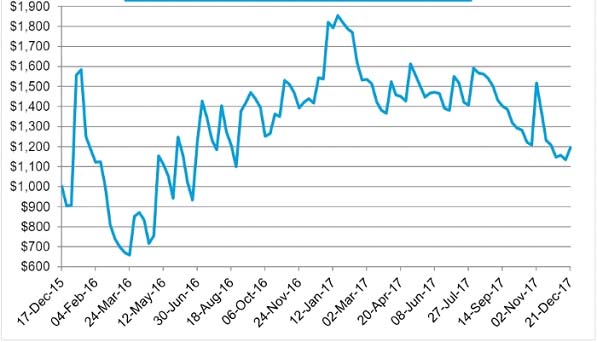
Source: Drewry
We also note that the increase in the SCFI index in the last trading session of the Shanghai Freight Exchange at the end of December 2017 is attributed to the announced by many container lines of GRI from January 1, 2018. For example, Maersk Line announced an increase in rates from the Indian subcontinent to the USA from 1 January 2018 at 300 USD / TEU and 400 USD / FEU. Similar steps were taken by many container lines and not only for this direction. As early as mid-December, 2017, according to the estimates of marine analysts, the GRI lines were supposed to lead to an increase in rates on most of the main container transportation routes by 200-250 USD / FEU.
As usual, in the 4th quarter, many lines introduced the so-called Winter Surchase for freezing ports. In particular, the APL line introduced from December 1, 2017 to March 31, 2018 a winter surcharge for St. Petersburg in the amount of USD 100 / TEU and USD 200 / FEU. The allowance applies to all containers coming from Asia, Australia, East Africa, N. Zealand, the Middle East and Southeast Asia. And the company CMA CGM introduced a winter surcharge for the ports of St. Petersburg, Ust-Luga and Bronka in the amount of 75 Euro / TEU for containers coming from the ports of Northern Europe and the Mediterranean (from December 1, 2017 to April 30, 2018) and 100 USD / TEU — for backbone services (from December 1, 2017 to March 31, 2018).
Contargo, the operator of barge transport, extended until January 31, 2018, extra charges for shipping containers through the ports of Antwerp and Rotterdam, introduced in July, due to the continuing delays in servicing barges. The two largest container ports in Europe have not been able to solve this problem, although barges account for more than 40% of the containers handled in the port of Antwerp in domestic traffic, and in Rotterdam they account for 45%. The delays that began in the spring of 2010 against the backdrop of services restructuring in connection with the creation of a new system of carrier alliances are still there. The problem was aggravated by the increase in the size of ocean liners, which creates an uneven load on the port infrastructure, and as a result leads to delays in servicing barges.
At the end of this section, we note that the dynamics of rates in the linear sector of container traffic in the 4th quarter of 2017 showed with clear clarity that the freight market is still under pressure from excess tonnage. In these circumstances, the desire of some line carriers to keep their market share will inevitably exacerbate competition, the most convenient mechanism of which is to reduce rates, i.е. unleash a new round of freight wars. Therefore, although in 2017 there was a recovery in the freight market, but the market strengthened only in relation to the unprofitable 2016 . In addition, this recovery is very fragile and very sensitive to the demand for transportation. According to one possible scenario, it is assumed that imports from China in 2018 may not grow as dynamically as it was in 2017. At the same time, the problem of tonnage redundancy will further exert pressure on rates (in 2018, 28 units of mega container carriers with capacity of more than 18 thousand TEU should be delivered). According to Alphaliner forecasts, the rates for Trans Pacific services can fall below the psychological markers in 1000 USD / FEU in 2018 to the ports of Western and 1600 USD / FEU — the Eastern coasts of the United States.
Economy of container transportations
The financial results of the 4th quarter and 2017 as a whole are only now being summed up, so only data on the results of the third quarter are currently published. And not even by all companies. For example, MSC traditionally does not advertise its financial, and production indicators. Of the data that can be found in the public domain, the following are noteworthy.
The net profit of Maersk Line in the third quarter of 2017 amounted to 220 million against a net loss of $ 116 million for the same period last year. Recall that the profit of Maersk Line could be much higher if it were not for the losses from the consequences of the summer cyber attack, which violated the system of bookings of containers for 12 days.
The net profit of CMA CGM for the third quarter of 2017 was $ 323 million against a net loss of $ 268 million for the third quarter of 2016. Revenue for the same period increased by 27.7% to $ 5.7 billion. USD. The growth of CMA CGM revenue by 27.7% was provided by two main factors: an increase in transportation volumes by 11.6% (from 4.46 to 4.98 million TEU) and growth of rates by 14.2% (from 1022 to 1145 USD / TEU).
Hapag-Lloyd for the third quarter of 2017 received a net profit of 54.3 million euros compared to a loss of 8.2 million euros over the same period last year. In general, following the results of 9 months of 2017, the net profit of Hapag-Lloyd was 8.2 million Euros, while in 9 months of 2016 there was a net loss of 133.9 million Euros.
Yang Ming declared a net profit of $ 42 million in the third quarter of 2017, compared to a loss of $ 496 million in the same period last year.
OOCL significantly improved its financial results in the third quarter of 2017. Only in the direction of Asia-Europe, the company’s revenue increased by 26.1 and 13%, respectively.
The net profit of $ 36.2 million in the third quarter of 2017 was declared by ZIM on the back of losses of $ 40.4 million for the same period last year.
Japanese companies NYK, MOL and K Line also got positive results in the 3rd quarter of 2017 in the container transportation sector.
Thus, following the results of the third quarter of 2017, the majority of container lines received a profit compared to losses a year earlier. The prevailing view is that, despite a certain decrease in rates, the fourth quarter of 2017 was also successful for container carriers. Overall, by the end of 2017 it is expected that container lines will receive a total profit of $ 1.5 million with its increase by another 5-10% in 2018.
Returning to the profitability zone has prompted many container carriers to return to fleet renewal programs, as evidenced by the sharply increased in comparison with 2016 number of orders for new container ships. Unlike the 3rd quarter, with the orders of 20 mega container ships with the capacity of 22,000 TEU, in the 4th quarter of 2017 the maximum size of newly ordered vessels was 11,000 TEU. However, in December 2017, the head of Hyundai Merchant Marine made a loud statement that in 2018 HMM will start implementing a project to build container ships with capacity of 22,000 TEU. Perhaps, it will be so, but so far in nine months of 2017, HMM has suffered serious losses.
Representative orders for new container ships in the 4th quarter of 2017
| Shipyard | Number of ships, units | Container capacity,
TEU |
Vessel price, mln. USD | Delivery time,
year |
Shipowner / Operator |
| FUJIAN SOUTHEAST | 4 | 640 | 9,85 | 2019 | ANSHENG SHIPPING |
| WUT GUANGDA* | 6 | 1140 | 7,50 | 2019 | COSCO, SINOTRANS |
| HUANGPU WENCHONG | 4 | 1500 | н.д. | 2019 | COSMOSHIP |
| JIANGSU NEW YZJ | 2+2 | 1668 | 19,6 | 2019/20 | RCL |
| JIANGSU YANGZIJIANG | 3 | 2200 | 29,0 | 2019/20 | CMA CGM |
| GUANGZHOU WENCHONG | 1 | 2700 | 28,5 | 2019 | LOG-IN LOGISTICA |
| JIANGSU NEW YZJ | 2+2 | 2700 | н.д. | 2019 | SITC |
| HYUNDAI HI | 5 | 11000 | 90,0 | 2019 | ZODIAC MARITIME |
* – River sea Source: Intermodal, Advanced, Allied
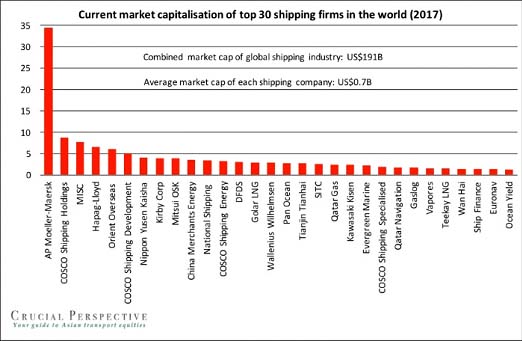
Taking into account the fact that fleet renewal programs require very significant financial resources, marine analysts note the following points. Currently, the total capitalization of 30 leading shipping companies, whose shares are quoted on stock exchanges, is only $ 191 billion, of which $ 34 billion belongs to Maersk alone. At the same time, repaying only the capital costs (CAPEX) of the marine industry requires $ 231 billion, i.е. exceeds the capitalization. At the same time, the average market value of shipping companies participating in exchange trades is only $ 700 million.
Over the past 12 months, international shipping has managed to attract only $ 8.2 billion in the cash market, of which 61% came from Asian ship owners, 38% from European and 1% from American ship owners.
Current capitalization of 30 leading shipping companies in the world
Given the low profitability of the shipping industry and the high volatility of freight rates, financial institutions after the 2009 crisis are extremely negative about allocating money to the fleet, especially for medium and small companies. And mainly in Europe. It’s enough to say that such recognized heavyweights as Royal Bank of Scotland, Commerzbank and Lloyds Banking Group refused to finance shipping at all, and HSH Nordbank and Nord / LB Group are actively getting rid of shipping credit portfolios. So, HSH Nordbank reduced its shipping portfolio from 17 to 12 billion euro (for 9 months) by September 2017, and Nord / LB Group — from 16.8 to 13.3 billion euro over the same period. According to Petrofin at the beginning of 2017, the total loan portfolio of 40 leading banks financing the shipping industry was $ 355.25 billion, which is 42.5 billion less than a year ago. At the same time, the tendency towards reduction is primarily demonstrated by European banks, while the share of Asian, mainly Chinese, banks is constantly growing. It is expected that by the end of 2017, China will spend $ 20 billion on shipping financing, which is 33% more than in 2016. Especially popular in China in recent years is the leasing scheme, which makes it possible to finance 85% of the cost of construction of a new vessel at 5.5% per annum. Currently, the three leading leasing companies of the People’s Republic of China — ICBC Financial Leasing Co., Minsheng Financial Leasing Co. (MFL) and Bank of Communications Financial Leasing Co. own fleet of more than 800 ships totaling $ 23.6 billion. At the same time, the MFL portfolio has doubled in the last 3 years to $ 6 billion, while the ICBC portfolio, which in 2009 amounted to $ 600 million, has now reached $ 10 billion.
Representative deals for the sale of container tonnage in the 4th quarter of 2017
| Vessel name | Construction year | Container capacity, TEU | Price, mln. USD |
| JRS CARINA | 2007 | 698 | 3,30/2,70* |
| ASTURIANO | 2003 | 1118 | 3,80 |
| KRETA | 1998 | 1145 | 3,60 |
| SINAR BUTON | 2008 | 1200 | 7,50/7,40* |
| MTT PORT KLANG | 2001 | 1216 | 4,70 |
| FSL SANTOS | 2003 | 1221 | 9,40 |
| TIGER GOMAN | 2007 | 1338 | 7,00/7,40* |
| HS LISZT | 2008 | 1345 | 7,00/7,60* |
| UAFL ZANZIBAR | 1996 | 1684 | 4,00 |
| SAIGON BRIDGE | 2008 | 1708 | 9,50/8,70* |
| HANSA MAGDEBURG | 2003 | 1740 | 4,70/5,00* |
| SANTA FRANCESCA | 1998 | 2169 | 4,30/3,70* |
| FRISIA HANNOVER | 2006 | 2478 | 11,50 |
| CHITTAGONG | 2007 | 2483 | 10,80/10,50* |
| WUHAN TRADER | 2008 | 2564 | 10,00 |
| CAP BLANCHE | 2006 | 2723 | 10,60/11,00* |
| CAP PASADO | 2006 | 2723 | 10,70/11,20* |
| VILANO | 2006 | 2723 | 10,60/11,10* |
| PASSAT SUMMER | 2005 | 2732 | 8,00/9,10* |
| PENELOPE | 2008 | 2732 | 10,60 |
| HS ONORE | 2006 | 2846 | 8,75 |
| SONGA ALYA | 2004 | 3091 | 8,50 |
| WIDUKIND | 2006 | 3091 | 9,25 |
| HEDDA SCHULTE | 2013 | 3421 | 13,00 |
| APL ATLANTA
APL LOS ANGELES APL DENVER APL OAKLAND |
2008
2008 2008 2008 |
4250
4250 4250 4250 |
25,00
25,00 25,00 25,00 |
| MOL DEDICATION | 2008 | 4250 | 9,80 |
| SUI TAI RICKMERS | 2008 | 4250 | 9,80 |
| QUEENS QUAY | 2003 | 4253 | 8,50 |
| ALS FAUNA | 2008 | 4275 | 13,80 |
| BONAIRE | 2010 | 4360 | 12,00/10,90* |
| AS MARIANA
AS MARIELLA AS MAGNOLIA |
2010
2010 2009 |
4380
4380 4380 |
14,80
14,80 14,80 |
| JULES VERNE | 2010 | 4426 | 10,30 |
| SCT QATAR
SCT OMAN |
2010
2010 |
4892
4892 |
11,00/11,80*
11,00/11,60* |
| LONG CHANG | 2004 | 5060 | 9,50 |
* – Vesselvalue.com Source: Intermodal, SeaSure
In conclusion, we note that an increase in the yield of container shipments in 2017 led to a sharp increase in sales activity in the used tonnage segment. In 2017, 285 container carriers with total deadweight of 12.46 million tons and total capacity of more than 1 million TEU, found a record number of their new owners. The total value of these vessels amounted to 2.37 billion US dollars.
Dynamics of sales of used container tonnage in 2012-2017
| Period | Number of containerships sold, units | Total deadweight,
tons |
Average age, years | The total cost of sales,
mln. USD |
| 2012 | 139 | 3262603 | 15 | 1022,4 |
| 2013 | 180 | 5304442 | 12 | 1840,7 |
| 2014 | 182 | 6944855 | 11 | 1862,9 |
| 2015 | 219 | 7640657 | 12 | 2724,4 |
| 2016 | 113 | 4426131 | 11 | 1157,3 |
| 2017 | 285 | 12455613 | 11 | 2367,0 |
Source: ALLIED Shipping Research
Service modernization
As already noted in the previous sections, in response to a decrease in demand, many container lines are using to the practice of «blank» flights or the cancellation of individual flights. So, in the period of the expected decline in demand after the peak season and on the eve of the Christmas holidays in Europe, OOCL decided to cancel some flights. In particular, on the route Asia — Northern Europe, a flight was canceled on the Loop 3 service, which was to carry out the container vessel CSCL Uranus with an exit from Ningbo and arrival in Antwerp. On the route Asia — the Western Mediterranean, a flight was canceled on the WM1 service, which was to carry out by the container ship Al Riffa with an exit from Qingdao and arrival in La Spezia. And in the company APL took off the flight on the service Far-East Express 7 (FX7), where according to the schedule the vessel was to come to Ningbo on November 18 and in Piraeus on December 15. For the same reasons, CMA CGM canceled flights by the end of 2017 / beginning of 2018 on Atlantic Mediterranean Express and Atlantic East Coast Express services.
Of the other noteworthy changes in services, the following should be cited. COSCO Shipping, together with Evergreen Line and Yang Ming, launched the Europe-Med Express (EMX) service in November with the following rotation of the ports of call: Rotterdam — Felixstowe — Hamburg — Antwerp — Casablanca — Piraeus — Alexandria — Haifa — Mersin — Piraeus — Casablanca — Rotterdam. The service serves five container ships with a capacity of 4250 TEU (one from Evergreen and Yang Ming and three from COSCO Shipping).
Hyundai Merchant Marine (HMM) together with Sinokor in late December launched a new service Korea — China — Russia, which provides calls to Central and South China. The service involved five container ships with a capacity of 1000 — 1700 TEU with an additional call to Korea. Service to Central China under the name CRE (China Russia Express) has the following rotation of the ports of call: Shanghai — Ningbo — Busan — East — Vladivostok — Busan — Shanghai. The service to South China under the name KHR (Korea-Haiphong-Russia Express) provides access to the ports: Busan-Ulsan-Kwangyang-Hong Kong-Haiphong-Shekou-Xiamen-Busan-Vostochny-Busan.
In the Mediterranean region, ZIM has announced changes since January 2018 in the TGX service, including Iskenderun. Now the TGX service has the following rotation of the ports of call: Haifa — Ashdod — Iskenderun — Antalya — Istanbul (Ambarli) — Izmit — Gemlik — Istanbul (Ambarli) — Piraeus — Izmir — Haifa. Thanks to the new rotation, the transit time for the delivery of containers from Piraeus to Haifa will decrease from 1 to 4 days.
But the main changes in the existing systems of the main alliance lines of container carriers are expected from April 2018. In particular, the Ocean Alliance leader CMA CGM announced the launch in April 2018 of the Ocean Alliance Day Two Product. It is assumed that from this period, 340 container ships with total capacity of 3.6 million TEU will serve 41 lines, inclгвштп 20 trans Pacific services, 6 services in the direction of Asia-Europe, 4 Asia-Mediterranean services, the same number of transatlantic services, 5 Asia-Middle East services and two Asia-Red Sea services. Directly, CMA CGM will provide 122 of its container carriers for these services.
Hapag-Lloyd, K Line, MOL, NYK and Yang Ming, members of another association — THE Alliance, also decided to expand their services from April 2018, using 250 of their container ships on 33 services, linking more than 80 ports of Asia, Northern Europe, the Mediterranean, North America, Canada, Mexico, Central America, the Caribbean, the Indian subcontinent and the Middle East. The updated system of services THE Alliance will consist of five services on the Asia-Europe trade, and three services in the Mediterranean market. At the Trans Pacific, there will be 16 services at once. Another seven routes will be presented in the North Atlantic with ship calls to the ports of Northern Europe and the Mediterranean, and two more to the Middle East.
Rotation of ports of call on the Asia-Mediterranean trade will include:
MD 1: Qingdao — Busan — Shanghai — Ningbo — South China — Southeast Asia hub — Dumyat — Barcelona — Valencia — Tangier — Dumyat — Southeast Asia hub — Hong Kong — Qingdao;
MD 2: Busan — Qingdao — Ningbo — Shanghai — Kaohsiung — South China — Southeast Asia hub — Piraeus — Genoa — Spice – Fos — Piraeus — Southeast Asia hub — Hong Kong — Busan;
MD 3: Busan — Shanghai — Ningbo — South China — Southeast Asia hub — Jeddah — Ashdod — Istanbul (Ambarli) — Izmit — Izmir / Aliaga — Mersin — (Ashdod) — Jeddah — Southeast Asia hub — Kaohsiung — Busan.
Rotation of ports of call on two services with calls to the Mediterranean Sea on a trade across the Atlantic includes:
AL 6: Salerno — Livorno — Spice — Genoa — Fos — New York — Baltimore — Norfolk — Savannah — Salerno;
AL 7: Barcelona — Valencia — Algeciras — Halifax — New York — Norfolk — Savannah — Valencia — Tarragona.
Based on materials of marine periodicals