Valery Voynichenko, Ph.D., freight reviewer
Ending. The beginning in issue 9 (158)
Consolidation of container business
Consolidation of container business in recent years is only gaining momentum. As already noted, of the twenty largest world container carriers that existed two years ago, only 12 large companies have lived. Moreover, it is expected that within the next decade their number will decrease to half a dozen or even less. After the achieved agreement of COSCO Shipping in the 2 nd quarter on the acquisition of OOCL, another step towards consolidation was made — a statement on the establishment of the Korea Shipping Partnership (KSP), which should include 14 South Korean container carriers, including Hyundai Merchant Marine appeared. It is assumed that these carriers will unite in order to find new opportunities in the market. They will also increase the total capacity of ships, add new routes and will jointly manage the terminals. It is planned that the KSP association will begin its work from January 2018.
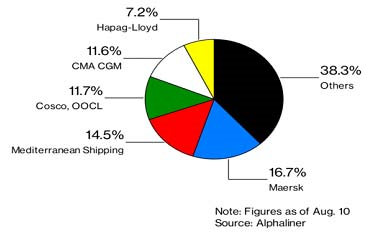
Currently, the top five players in the container market in the Maersk Line, MSC, CMA CGM, COSCO (including OOCL) and Hapag-Lloyd control about 60% of the transportation capacity. The market share of the three major alliances of container carriers by fleet capacity is currently 78%.
Market share of the top five leading container carriers
in the 3rd quarter of 2017
Market share of the main container alliances taking into account the current and ordered fleet *
| Alliances of container carriers | Market share,% | ||
| The current fleet | Portfolio of orders | Total | |
| 2M | 33,8 | 19,8 | 31,9 |
| Ocean Alliance | 26,7 | 41,5 | 28,6 |
| The Alliance | 17,6 | 16,3 | 17,4 |
| Total | 78,1 | 77,6 | 77,9 |
* – without taking into account the orders of MSC and CMA CGM companies mega container ships with capacity of 22 thousand TEU Source: BMTI
It is indicative that one of the main driving forces of the consolidation observed in the container market is the state exit from the transportation business, including the Middle East (UASC) and Singapore (NOL), and the South Korean government’s refusal in state support to the Hanjin Shipping Company forced it to declare its bankruptcy in the past year. The second echelon of consolidation is the further strengthening of the system of alliances of container carriers, currently controlling about 80% of global container shipments. However, according to the management of Maersk Line, the benefits from full-fledged mergers are much greater than from alliances: the gain is due, among other things, by reducing costs, unified accounting reporting and improving the quality of port operations. In addition, the process of consolidating the industry can accelerate the introduction of digital technologies in the container business.
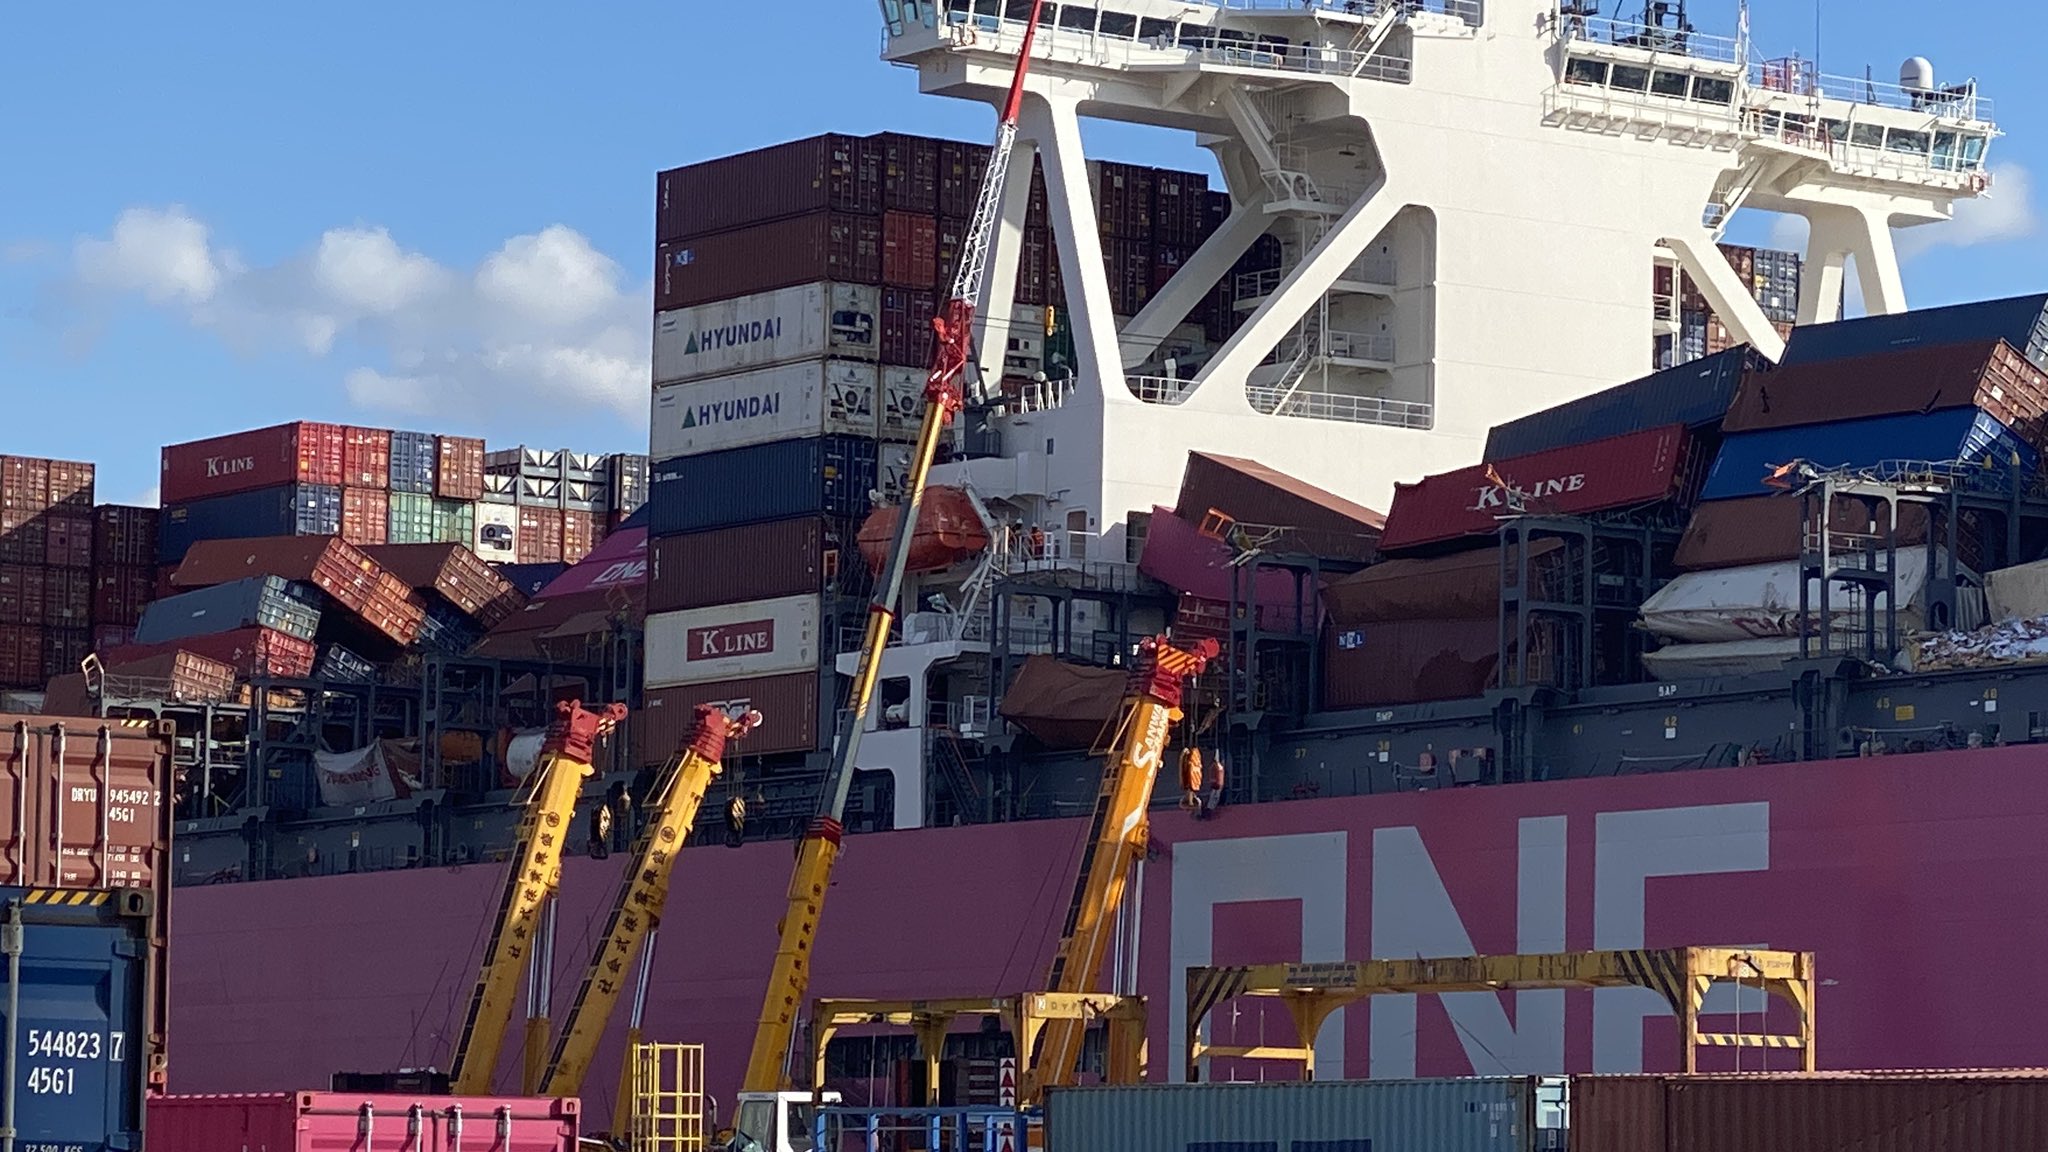
It should also be noted that the wave of consolidation affected not only container carriers, but also terminal operators. Rapidly increasing ship sizes increase pressure on terminal operators, forcing them to expand capacity and upgrade operations. Accordingly, a certain impact on the consolidation of the terminal business in the coming years will also be provided by the portability of the ports to accept mega container ships with capacity of 19-20 thousand TEU. Currently, there are only 20 such ports worldwide. Among them: Dalyan, Kaxinggang, Qingdao, Busan, Ningbo, Shanghai, Yantian, Tanjung Pelepas, Bremenhafen, Hamburg, Gothenburg, Arhus, Wilhemshafen, Antwerp, Rotterdam, Singapore, Kwanyang, Xianen, Gdansk and Felixstowe.
Analysts at Drewry in their Global Container Terminal Operators Annual Report 2017 note that mergers and acquisitions in the port area have also taken on an incredibly large scale. Suffice it to say that, according to Drewry, for 7 months of 2017, $ 3.1 billion was spent on these purposes. As a result, the existing landscape of the terminal business has undergone serious changes, which in the future will only increase. The processes of consolidation of terminal business are most active in China, where they are being asked by COSCO Shipping Ports and China Merchant Ports. The restructuring of container terminals in the port of Dalian, where the Dalian Port Container Terminal (DPCT) and the Dalian International Container Terminal (DICT), merged into one legal entity Dalian Container Terminal (DCT). Apparently, in the near future, we should expect other significant changes aimed at optimizing and modernizing the terminal business of the PRC. In addition, within the framework of the strategy of the revival One Zone — One Way, which China has elevated to the state policy level, Chinese companies are increasing their presence in the terminal business around the world.
Thus, the most significant trends in the container business in recent years are an increase in scale and consolidation, which should be attributed to the category of cardinal changes, which make it possible to say that the industry continues to evolve. Over time, this may allow to make the conditions of the industry more stable, which, in the long run, will have a positive effect for both line operators and their customers.
Container turnover of ports and regions
According to Alphaliner, in the first half of the year the container turnover of 250 sea ports of the world increased by about 6.7% compared to the same period last year. In the second quarter of this year, growth in volumes accelerated to 7.4%, compared to 5.9% in the first quarter, and by the end of the year, container transshipment volumes could grow by more than 6% to reach a six-year high. Conclusions made by Alphaliner very closely correlate with the forecasts of analysts of Drewry, assessing the growth rate for the first half of the year at 6.6%, and also predicting a record growth in general for 2017.
According to Container Trade Statistics, the volume of container traffic on routes from the ports of Asia to Europe for 7 months of 2017 increased by 5.3%, amounting to 9.4 million TEU. In the opposite direction to Asia, volumes increased by 3.7%, to 1.6 million TEU. But on the trans-Pacific services in the direction of the US, growth in volumes was 7.3%, and in the opposite direction, traffic increased by 8% to 2.7 million TEU. In general, according to this source, it is expected that the global market of sea container traffic will grow by 5.2% in 2017.
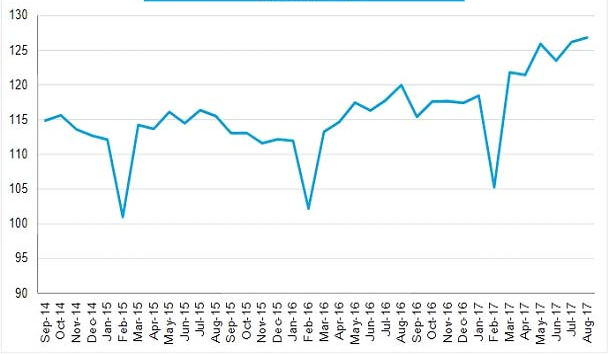
In August 2017, the Container Port Throughput Indices calculated by Drewry based on the data of 220 ports of the world, accounting for approximately 75% of the global container turnover, reached 126.8 points, which is the maximum value of this index since its beginning in January 2012. Compared with July the CPTI index rose by 0.6 points, or 0.5%, but in the annual section — by 6.8 points, or 5.7%. At the same time, the largest increase was shown by African countries (+ 14.3%), but more significantly — North America (+ 7.0%). China and Europe showed the same increase of 5.1%.
Dynamics of Container Port Throughput Indices from September 2014 to August 2017.
Dynamics of CPTI by countries and regions in the monthly and annual sections
as for August 2017.
| Country/Region | August 2016 | June 2017 | August 2017 | Changes in the monthly section (%) | Changes in the annual section (%) |
| Composite index | 120,0 | 126,2 | 126,8 | +0,5 | +5,7 |
| China | 129,5 | 136,8 | 136,1 | -0,5 | +5,1 |
| Asia (without China) | 115,6 | 120,6 | 121,2 | +0,5 | +4,9 |
| Europe | 108,7 | 114,7 | 114,2 | -0,5 | +5,1 |
| North America | 1287 | 133,9 | 137,7 | +2,8 | +7,0 |
| Latin America | 107,0 | 110,4 | 113,5 | +2,8 | +6,1 |
| Africa | 102,7 | 107,2 | 117,4 | +9,6 | +14,3 |
Source: Drewry Maritime Research
According to Drewry, in January-August, 2017, demand for transportation from Asia to the Mediterranean ports grew by 5.7%, and to the east coast of the Mediterranean Sea by 6.1%. It is noted that the dynamics of demand in the niche markets of the Black Sea and the Adriatic are still ahead of the other subregions. According to Ruscon, the container turnover of the ports of the Black Sea countries in the first half of 2017 showed rather high growth rates, much higher than those that took place in 2015-2016.
Container turnover * of ports of Black Sea countries
in 2014 — the first half of 2017
| Country | 2014 | 2015 | 2016 | 1st part of 2017 | ||||
| ths.,TEU | change, % | ths.,TEU | change, % | ths.,TEU | change, % | ths.,TEU | change, % | |
| РФ | 721 | – | 584 | -19 | 613 | +5 | 395 | +18 |
| Румыния | 581 | – | 611 | +5 | 632 | +3 | 317 | +7 |
| Украина | 667 | – | 519 | -22 | 680 | +2 | 364 | +9 |
| Грузия | 447 | – | 380 | -15 | 329 | -13 | 144 | +18 |
| Болгария | 196 | – | 200 | +2 | 205 | +2 | 116 | +8 |
* – without transshipment Source: Ruscon
We also add that the growth in container shipments in the direction of the Mediterranean encourages carriers to increase the size of container ships serving this direction. Operators began using ships with capacity of 14,000 TEU or more, displaced by even larger giants that are being put into operation serving Northern Europe.
Container turnover of some countries, terminals and ports of the world
for the 9 months of 2016 and 2017.
| Port/Country | Container turnover
9 months of 2016 ths. TEU |
Container turnover
9 months of 2017 ths. TEU |
Change
(+) (-), 2017/2016, % |
| DP World Terminals | 47070,0 | 52300,0 | +10,0 |
| Shanghai (PRC) | 27448,2 | 29900,0 | +8,2 |
| Singapore | 22912,3 | 24770,0 | +7,5 |
| Hong Kong (PRC) | 14212,2 | 15635,0 | +9,1 |
| Rotterdam (Netherlands) | 9169,8 | 10200,0 | +10,1 |
| Antwerp (Belgium) | 7548,5 | 7798,0 | +3,2 |
| Los Angeles, USA) | 6325,0 | 6890,0 | +8,2 |
| Long Beach (USA) | 5065,2 | 5560,0 | +8,9 |
| Ports of the Russian Federation including: | 2960,0 | 3400,0 | +14,9 |
| The Baltic Basin | 1500,4 | 1670,0 | +11,3 |
| Far Eastern Basin | 859,0 | 1090,0 | +26,9 |
| Azov-Black Sea basin | 466,8 | 538,4 | +15,3 |
| The Big Port of St. Petersburg | 1300,0 | 1430,0 | +10,0 |
| Gdansk (Poland) | 948,9 | 1123,0 | +15,5 |
| Riga, Latvia) | 268,8 | 323,9 | +17,0 |
| Tallinn (Estonia) | 148,8 | 157,1 | +5,5 |
| Ports of Ukraine *, including | 453,7 | 420,6 | -5,1 |
| Odessa Sea Commercial Port | 363,3 | 371,5 | +2,2 |
| Commercial Sea Port Yuzhny | 59,1 | 49,1 | -20,3 |
*- without Ilyichevsk Sea Commercial Port Source: marine periodicals
The data on container processing in some ports and terminals in the world for the first three quarters of 2017, shown in the open sea period, also show high growth rates. Thus, in 9 months of 2017 the container turnover of the terminals DP World increased by 10%, the port of Shanghai by 8.2%, Singapore by 7.5%, Hong Kong by 9.1%, Rotterdam by 10.1 %% , Los Angeles — 8.2%, Long Beach — 8.9% and Gdansk — 15.5%. In most cases, in the third quarter, the growth rate of container turnover exceeded the figures for the first half of 2017, for example, at terminals DP World they amounted to 13.5% against 10.0% in the first half of 2017 .
Supply / demand balance and market players forecasts
Demand for transportation
According to Container Trades Statistics (CTS), the total volume of sea container traffic for the first seven months of 2017 increased from 88.5 to 92.7 million TEU (+ 4.7%). The maximum growth rates are fixed on key routes of transportation — from Asia to Europe and on routes through the Pacific Ocean, which is due to the acceleration of economic growth in Europe and the United States. As already noted, in 2017 the demand for container transportation between the ports of Asia and the Mediterranean is again ahead of the dynamics of the neighboring market segment in the direction of Asia — Northern Europe / Mediterranean.
According to Alphaliner, the volume of container exports from China (including Hong Kong) for nine months of this year increased by 9%, reaching 192 million TEU. At the same time it is expected that, by the end of the year, the total volume of container traffic will increase by more than 6%. Thus, the analysts’ opinion that the container industry has reached a mature phase of development and its growth rates will not exceed the increase in GDP is refuted. The reason for this conclusion was that in 2016 the ratio of the growth rates of container transportations and world GDP was close to unity, while in 1997-2007, it was about 2.8-3.1. Although in 2011-2016 this ratio was, on average, 1.7. Approximately at the same level (1.75-1.85), this ratio is likely to remain in 2017. Therefore, most likely, the times when the growth rates of the container market outpaced the dynamics of GDP more than two or three times, are unlikely to return.
According to Drewry, the growth of container traffic in 2017 will be 5.5%. This causes some surprise, considering that at the beginning of the year a number of factors did not give cause for optimism. Among them: Brexit and the prospect of a further collapse of the EU, plus the risk factors caused by Trump’s position on a number of issues of international trade, sanctions, etc. That is, despite all the fears, the reality turned out to be more optimistic than the earlier forecasts with an impressive pessimistic component. Today, this pessimism is spread on 2018, in which, according to Drewry, demand for transportation will increase by only 3.5%.
The ratio of growth rates of world container transportations and GDP from 1997 to 2016
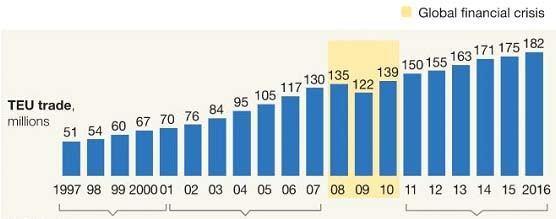
Source: McKinsey Alphaliner
The ratio of the rate of container traffic and the world’s GDP growth %
| Indicators | Period, years | ||
| 1997-2000 | 2001-2007 | 2011-2016 | |
| 1. Average growth rates of container transportations | 8,3 | 10,8 | 3,8 |
| 2. Average growth in world GDP | 3,0 | 3,4 | 2,3 |
| 3. The ratio 1: 2 | 2,8 | 3,1 | 1,7 |
Source: McKinsey
Tonnage supply
In terms of supply, the capacity of the world container fleet, according to Container Trade Statistics for January-July 2017, increased by 2.1%, mainly due to the supply of vessels with capacity of more than 12,000 TEU, while in segments of smaller vessels the size of the tonnage growth even slightly decreased. It is expected that the supply of new container ships in 2017 will be about 1.1 — 1.3 million TEU.
The lull in the field of orders for new container ships, which has been running since December 2015, has led to the fact that the global portfolio of orders for vessels of this type has decreased from 4 to 2.6 million TEU (which was the minimum since 2003), in the 3d quarter of 2017 was interrupted. In the beginning, the Mediterranean Shipping Company (MSC) ordered 11 container ships in South Korea with capacity of 22 thousand TEU with a total cost of about 1.5 billion dollars. Then the company CMA CGM placed an order for the construction of nine container ships of the same capacity, but to the Chinese shipyards Shanghai Waigaoqiao Shipbuilding and Hudong Zhonghua Shipbuilding at a cost of $ 133 million each.
It is clear that delivery in 2019-2020 of 20 mega container ships with total capacity of 440 thousand TEU on the market is unlikely to radically change the balance of supply and demand, but certainly — will not contribute to its improvement, having the corresponding negative pressure on freight rates.
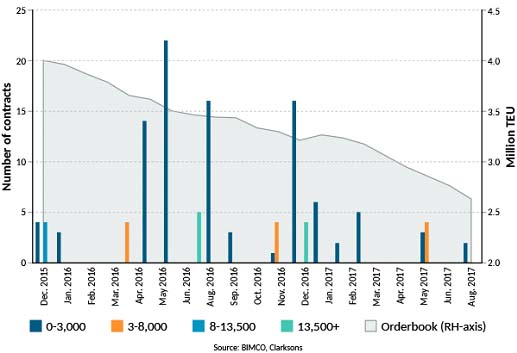
The global portfolio of orders and shipments of new container ships with a breakdown by tonnage capacity from December 2015 to August 2017.
Even in the 3rd quarter of 2017, despite the seasonal increase in container shipments due to the peak season, the freight market showed no increase, but a certain drop in both spot and contract rates for container shipments, as described in the first part of this review. It should be noted that the weakening of the freight market was influenced by the reduction of the tonnage at bay, as well as a sharp slowdown in the rate of delivery of container ships to scrap. According to Alphaliner, by the end of August the number of container ships laid up reduced to 151 ships with total capacity of 378 thousand TEU — and continued to decrease until the middle of September, which is the minimum indicator for recent years. For the first time since August 2015 this indicator fell below the 500 thousand TEU. Since the second half of September, the growing imbalance between supply and demand has forced shipowners and operators to put part of the fleet on holding anchorage. According to Alphaliner, by the end of 2017 the tonnage of containerships laid up can grow up to 950 thousand TEU.
Representative deals on sales of container trucks for scrap
in the 3rd quarter of 2017
| Vessel name | yearпострой-ки | Deadweight/TEU | Price | |
| млн. USD | USD/ LDT | |||
| RULA | 1977 | 4415 | 0,71 | 370 |
| CONCORD | 1992 | 17446 | 2,10 | 360 |
| UNI-CONCERT | 1993 | 17446 | 2,10 | 360 |
| WESTERBURG | 1997 | 30291 | 4,51 | 423 |
| E.R. HAMBURG | 1998 | 30700 | 4,56 | 397 |
| MSC GEORGIA | 1985 | 33823 | 3,48 | 404 |
| MAERSK PEMBROKE | 1998 | 38250 | 3,03 | 302 |
| MSC FLORIDA | 2005 | 58287 | 8,96 | 418 |
| MSC MYKONOS | 1988 | 60639 | 9,97 | 425 |
| APL CORAL | 1998 | 64145 | 9,64 | 420 |
| HYUNDAI GENERAL | 1996 | 68363 | 9,56 | 415 |
Source: Fairplay
Due to the somewhat slowed down rate of tonnage utilization in recent months, it is expected by the results of 2017 that ships with total capacity of approximately 440 thousand TEU will be withdrawn from service.
In general, according to the results of 2017, Container Trade Statistics predicts a growth in the capacity of the global container fleet at 3.4%, and in 2018 — 4.0%. As for BIMCO, they expect 3.5% and 4.0% respectively. According to the estimates of Drewry, the increase in the container fleet due to large-scale shipments of mega container ships in 2018 is estimated at 5%.
Growth in the supply of container tonnage from 2013 to 2019
Forecasts of the market players
Inspired by the high demand for transportation this year, leading players of the container market in the third quarter of 2017 repeatedly made loud statements about its restoration. Among them the management of APL, Hapag-Lloyd, Maersk Line, etc. In particular, the management of Maersk Line estimated the fundamental factors in the container market that developed in 2017 as the most favorable since 2010.
Recall that, according to Drewry, the increase in container fleet due to large shipments of mega container ships in 2018 is estimated at 5%, while demand for transportation will increase by only 3.5%. The Analyzes of Capital Investment Management (CIM), which estimate the growth of container tonnage in 2018 at the level of 5.1%, and the demand for transportation — 3.2%, show practically the same fugures. That is, the imbalance between supply and demand will not only decline, but even increase. In this connection, CIM does not expect the container tonnage market restore earlier than in 2019.
According to many analysts, the global container market in 2017 returned to a normal growth model, but as early as 2018, growth may slow in the short and medium term. That is, already in 2018, operators will have to work in conditions of increasing the capacity of the global fleet by 1.3 million TEU against the background of a slowdown in demand growth.
In its study, Sea Intel gives three options for forecasting the dynamics of demand: according to a pessimistic forecast, the annual growth in demand in the period from 2017 to 2019 will be 2%; according to the realistic one — 5%, according to the optimistic scenario — 8%. At the same time, the company notes that the planned increase in tonnage can be provided with demand only if the latter — optimistic scenario is implemented. According to Sea Intel, in the fourth quarter of 2017 capacity on services linking Asia and Europe will grow by 12%. In this situation, loading of ships will drop sharply, or carriers will have to cancel flights.
Thus, according to Sea Intel analysts, the recent fragile balance of supply and demand, allowing companies to generate profits, has been threatened by violations — and in the near future, carriers will have to make a choice: to reduce services or continue to increase excess tonnage, thus violating the fundamental factors of the market.
But there are other, more optimistic figures and opinions. Thus, analysts from Crucial Perspective expect a growth in container tonnage in 2018 of 3.6%, which almost corresponds to the growth in demand for transportation. And in the Jefferies Group they believe that throughout 2017-2019 the demand for transportation will outpace the supply of tonnage. CMA CGM believes that the growth in demand for transport in 2017 will be 4.0-4.5% with a net increase in tonnage of 3%, i.е. demand will outstrip supply with an appropriate positive effect on the freight market. We also add that, in the opinion of Drewry analysts, the swept wave of consolidation has significantly reduced the number of competitors in the container market, which makes it easier to solve the task of redistributing a new tonnage.
At the end of the review, for the sake of fairness, we note that if optimistic forecasts were fully justified for the first half of the year, then the dynamics of rates for container transportation in the third quarter of 2017 during the so-called peak season, made quite a dissonance. And it’s not about the demand for transportation, which was surprisingly high, but about excess of transportation capacity.
Based on materials from the sea periodicals