Valery Voinichenko,
Cand. Sc. (Economics)
Freight analyst
Time Charter Market
As distinct from the 1st and 2nd quarters, the 3rd quarter of 2019 made happy for the non-vessel operating container tonnage owners as they witnessed a well-defined upward move. Though during the 1st six months of the current year ConTex index of Hamburg brokers indicated reduction by 9 points or 2.2%, in the 3rd quarter it grew by 45 pints or 11.3%. At that, the rate of such growth was quite ambivalent for various classes of container carriers. By the end of September the small feeder container carriers had the time-charter component practically at the same level as in the beginning of June. Still, for 2,500-3,500 TEU ships the rates went up by 9.1-27.0%. However, as regards 4,250 TEU Panamax ships, the rates exceeded USD 5,000/day during the reviewed period, which means 52.6%. In other words, the time-charter rate growth in the 3rd quarter 2019 was due, mainly, to large container ships of Panamax and Post-Panamax sizes.
Dynamics of container time charter rates in the 3rd quarter 2019 according to ConTex index by Hamburg brokers
USD/day
| Container capacity, TEU | Beginning of July 2019 |
Beginning of August 2019 | End of August 2019 | End of September 2019 |
| 1,100 | 6,444 | 6,483 | 6,473 | 6,411 |
| 1,700 | 8,367 | 8,491 | 8,705 | 8,698 |
| 2,500 | 8,873 | 8,899 | 9,221 | 9,678 |
| 2,700 | 9,070 | 9,216 | 9,762 | 10,506 |
| 3,500 | 8,956 | 9,269 | 10,423 | 11,378 |
| 4,250 | 9,558 | 12,550 | 13,820 | 14,582 |
| ConTex index | 399 | 414 | 432 | 444 |
Source: VHSS
It is by that reason that the container indices of BRAEMAR BOX INDEX (BBI), HOWE ROBINSON INDEX (HRI) and HARPER PETERSEN INDEX (HPI) in the 3rd quarter noticeably outstripped ConTex because the former indices include larger container ship of the above mentioned classes. So, in the 3rd quarter BBI went up by 14.2%, HRI by 15% and HPI by 17.1%. Still, all these indices have shown an ever growing gap during 9 months of 2019. While ConTex increased by 8.8% from January to September, BBI grew up by 32%, HRI by 34.5% and HPI by 49.5%.
Dynamics of the main container indices in the 3rd quarter of 2019
| Index | Beginning of July 2019 | Beginning of August 2019 | End of August 2019 | End of September 2019 |
| BRAEMAR BOX INDEX | 76.8 | 81.8 | 84.8 | 87.8 |
| HOWE ROBINSON INDEX | 792.0 | 740.0 | 795.0 | 807.0 |
| HARPER PETERSEN INDEX | 619.0 | 671.0 | 713.0 | 725.0 |
Source: BMTI
Dynamics of the main container indices for 9 months of 2019
| Index | Beginning of January2019 | End of September 2019 | Changes, (+)(–), % |
| ConTex | 408 | 444 | +8.8 |
| BRAEMAR BOX INDEX | 66.5 | 87.8 | +32.0 |
| HOWE ROBINSON INDEX | 600.0 | 807.0 | +34.5 |
| HARPER PETERSEN INDEX | 485.0 | 725.0 | +49.5 |
Source: BMTI
Changes in the yearly time-charter rates by quarters and year according to Hamburg brokers
| Container capacity, TEU | for 3 Q of 2019 | for year | ||
| USD/day | % | USD/day | % | |
| 1,100 | -33 | -0.5 | -703 | -9.9 |
| 1,700 | +331 | +4.0 | -1,140 | -11.6 |
| 2,500 | +805 | +9.1 | -1,279 | -11.6 |
| 2,700 | +1,436 | +15.8 | -773 | -6.8 |
| 3,500 | +2,422 | +27.0 | -240 | -2.1 |
| 4,250 | +5,024 | +52.6 | +2,399 | +20.0 |
| ConTex | +45 | +11.3 | -36 | -7.5 |
Source: VHS
During the year the rates also grew for large-tonnage container carriers only, beginning from 4,250 TEU for which the growth amounted to USD 2,400/day or 20%. At the same period the current rates for 1,100-3,500 TEU container carriers fell behind from the last year level by USD 250-1,250/day or by 2.1-11.6%.
Analyzing the real time-charters of the 3rd quarter, it is possible to single out chartering of AKINADA BRIDGE container ship of 5,600 TEU capacity built in 2001. The ship is owned by EUROSEAS and time-chartered to for 10-12 months at USD 16,500/day. Another container carrier CAPE PIONEER of 6,882 TEU capacity built in 2017 was time-chartered by MAERSK LINE for a year в at USD 20,000/day. Significantly that in the previous 9-months time-charter of the same ship the rate was almost by 40% less, which tells about a serious consolidation of the market for that tonnage category. It can be only added that, according to Loadstar, in September the rates of Post-Panamax container carriers (having a greater number of refrigeration sockets) began to reach USD 25,000/day.
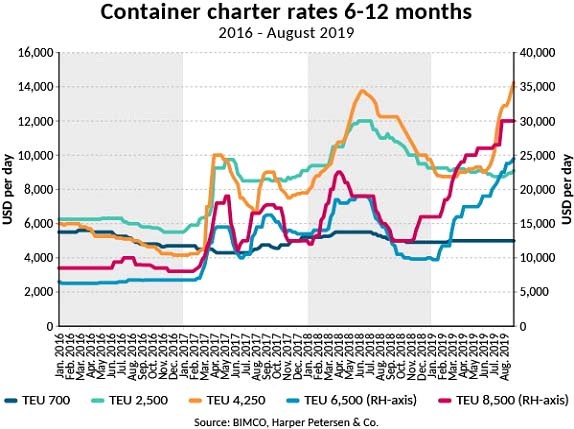
6-12 months long time-charter rates or container ships of various capacity in 2016-2019*
*-till August 2019
Indicative deals for container tonnage in 3rd quarter 2019
| Container capacity, TEU | Charter period, months | Time-charter rate, USD/day | Charterer |
| 698 | 2-3 | EURO 4650 | PORTLINE |
| 750 | 6 | 5,350 | CMA CGM |
| 877 | 4-8 | 5,700 | MAERSK LINE |
| 990 | 1 | 5,150 | DONGJIN SHIPPING |
| 1,008 | 6 | 7,100 | HAPAG LLOYD |
| 1,042 | 6 | 7,900 | ONE |
| 1,103 | 6 | 8,500 | SINOKOR |
| 1,118 | 4-6 | 7,200 | SEACON |
| 1,134 | 5-7 | 7,500 | SHREYAS S. |
| 1,432 | 4 | 7,800 | COSCO |
| 1,645 | 7-10 | 10,000 | SAMUDERA |
| 1,756 | 6-8 | 11,500 | OOCL |
| 2,532 | 10-12 | 10,000 | HAPAG LLOYD |
| 2,702 | 6 | 10,750 | OOCL |
| 2,826 | 4-6 | 10,500 | YANG MING |
| 3,091 | 12 | 10,500 | CMA CGM |
| 3,398 | 8 | 12,000 | MAERSK |
| 3,534 | 11-13 | 11,950 | ZIM |
| 4,178 | 5-7 | 15,000 | NILE DUTCH |
| 4,250 | 6-8 | 14,750 | SEA LEAD |
| 4,253 | 12 | 13,400 | ZIM |
| 4,253 | 6 | 12,200 | ARKAS DENIZCILIK |
| 4,253 | 7-10 | 14,600 | YANG MING MARINE |
| 4,600 | 4-7 | 13,950 | MAERSK LINE |
| 4,672 | 12 | 16,800 | MAERSK |
| 4,992 | 10-12 | 14,900 | RCL |
| 5,042 | 8-11 | 15,100 | FEEDERTECH |
| 5,470 | 6 | 14,250 | OOCL |
| 5,608 | 10-13 | 16,500 | KMTC |
| 5,828 | 7-8 | 21,000 | ONE |
| 6,039 | 12 | 22,000 | X PRESS FEEDERS |
| 6,589 | 9 | 23,800 | ONE |
| 6,845 | 18 | 29,800 | HAPAG LLOYD |
| 6,892 | 12 | 22,500 | OOCL |
| 7,241 | 12 | 26,000 | MAERSK LINE |
| 8,063 | 12 | 30,000 | MSC |
| 8,402 | 8 | 21,500 | OOCL |
| 8,643 | 10-12 | 30,000 | MSC |
Source: SeaSure
Liner traffic
Dynamics of the main indices that reflect movement of rates in the liner segment of container traffic in the 3rd quarter 2019 was clearly bearish. So, the aggregate SCFI index calculated by the Shanghai Shipping Exchange (SFE) for July-September lost more than 80 points or 10.9%.
Dynamics of Shanghai Containerised Freight Index in 3rd quarter 2019
| Container trades | 05.07.19 | 02.08.19 | 30.08.19 | 27,09,19 |
| Shanghai – Northern Europe (Hamburg, Antwerp, Felixstowe, Le Havre) | 688* | 806* | 757* | 593* |
| Shanghai — Mediterranean Barselona, Valencia, Genova, Naples) | 705* | 850* | 895* | 742* |
| Shanghai – USA West Coast (Los Angeles, Long Beach, Oakland) | 1,649** | 1,589** | 1,615** | 1,328** |
| Shanghai – USA East Coast (New-York, Savannah, Norfolk, Charleston) | 2,764** | 2,801** | 2,691** | 2,346** |
| Aggregate index SCFI | 810.91 | 830.94 | 819.65 | 722.90 |
* — USD /TEU; ** — USD /FEU Source: SSE
It is worth reminding that SCFI index is based upon spot rates for carriage in the services connecting Shanghai with the main container hubs of the world. From July to September the spot rates in Shanghai – Northern Europe leg decreased by USD 95/TEU or by 13.8%, though in the beginning of August, due to the general increase of rates introduced by a number of shipping lines, they were reaching USD 806/TEU. The North America services did not stay out of the downward trend as well. So, during the considered period in Shanghai – USA West Coast trade the rates went down from USD 1,649/FEU to USD 1,328 /FEU (-19.5%) and in Shanghai – USA East Coast – from USD 2,764/FEU to USD 2,346/FEU (-15.1%). It is in Shanghai – Mediterranean only that the end of September rates were by USD 37/TEU higher than in the beginning of July, i.e., grew by 5.2%. Still, as compared with the end of August, when the rates here jumped to USD 895/TEU, the one month drop equaled USD 152/TEU or 17.1%. All that occurred despite the traditional so-called «peak of the season» at that time which the container lines, actually, did not feel this year.
Another container index – CCFI calculated by SSE demonstrated a small drop in the 3rd quarter which told on the contract rates that went down from USD 815.01/TEU to USD 807.84/TEU (-0.9%). Hence, for the Northern European services the decrease in rates amount to USD 17.60/TEU (-1.8%) and for the USA East Coast– USD 12.62 /TEU (-1.4%). At the same time the rates of the Mediterranean services strengthened by USD 71.42/TEU (+6.9%) and the USA West Coast rates – by USD 14.07 /TEU (+2.0%). Still, as compared with the end of August, the contract rates, same as spot rates, were characterized in most scenarios by a downward trend.
Dynamics of China Containerised Freight Index in 3rd quarter 2019
USD/TEU
| Container trades | 05.07.19 | 02.08.19 | 30.08.19 | 27.09.19 |
| North European services | 975.75 | 972.10 | 1,021.29 | 958.15 |
| Mediterranean services | 1,042.04 | 1,006.59 | 1,215.40 | 1,113.46 |
| USA West Coast services | 689.80 | 723.93 | 691.57 | 703.87 |
| USA East Coast services | 890.62 | 936.51 | 897.54 | 878.00 |
| Composite index CCFI | 815.01 | 822.99 | 833.29 | 807.84 |
Source: SSE
Average SCFI and СCFI indices during 3 quarters of 2018-2019
| Indices | 3 Q 2018 | 3 Q 2019 | 2019/2018
(+) (–), % |
| SCFI aggregate index | 910.54 | 790.54 | -20.5 |
| incl. Shanghai – N. Europe | 785 | 721 | -8.2 |
| Shanghai — Mediterranean | 794 | 824 | +3.8 |
| Aggregate CCFI index | 846.80 | 821.58 | -3.0 |
| incl. Northern Europe services | 1,020.90 | 984.33 | -3.6 |
| Mediterranean services | 1,026.31 | 1,102.58 | +7.4 |
Source: SSE
The comparison of SCFI and СCFI indices by quarters and by 9 months periods with the similar figures of 2018 present a controversial picture. If we compare the 3rd quarter of 2019 with the same period of 2018, we can see that SCFI and СCFI composite indices turned to be by 13.2% and 3.0% lower accordingly. At that, the fall for the North European services was 8.2% and 3.6% accordingly while the Mediterranean services showed a growth by 9.8% according to SCFI index and by 7.4% according to CCFI index.
Falling of rates in the North European services and their growth in the Mediterranean services was generally observed by the results of 9 months of 2019 as compared with the same period of the last year.
NCFI dynamics in the 3rd quarter 2019
USD/TEU
| Services | Beginning of July 2019 | Beginning of August 2019 | End of August 2019 | End of September 2019 |
| Northern Europe | 508.12 | 643.53 | 568.50 | 426.94 |
| West Mediterranean | 530.66 | 764.66 | 698.59 | 564.59 |
| East Mediterranean | 492.21 | 674.75 | 620.73 | 500.59 |
| Black Sea | 564.40 | 745.89 | 698.19 | 570.94 |
| Aggregate NCFI index | 655.03 | 710.66 | 686.51 | 566.49 |
Source: NBSE
When analyzing the dynamics of NCFL index in the 3rd quarter of 2019 calculated by the Ningbo Shipping exchange (NBSE), we again witness the downward trend of the composite index by 88.54 points or 13.5%, and in North European services – by 81.18 points or 16.0%. At the same time the rates in the Mediterranean and Black Sea services slightly strengthened by the end of September (by 1.2-6.4%) as compared with the beginning of July, and a noticeable increase (by 23.5-26.2%) as compared with the beginning of August this year (when the lines attempted to raise the rates). In absolute figures the rates drop in the North European services for two last months was USD 216.59/TEU, in the West Mediterranean services – USD 200.07/TEU, in the East Mediterranean services – USD 174.16/TEU and in the Black Sea services – USD 174.95/TEU.
We also note that Drewry World Container Index (WCI) has also shown a clear downward trend in the 3rd quarter of 2019. By the end of September its value went down to USD 1,262.39/FEU. The average value of WCI composite index for 9 months of 2019 amounted to USD 1,437/FEU, which is 26.7% less than for the similar period of the previous year.
Container lines tried to counteract the rates drop by using blank shipments and reduction of their services capacity. For instance, if in the 2nd quarter the weekly capacity of container services grew in excess of 3%, then in the 3rd quarter it increased by 0.5% only, and in the Far East – Europe trade is even reduced by 2.5%. However, as we see, it helped a little.
Dynamics of Drewry World Container Index from September 2017 to September 2019
USD/FEU
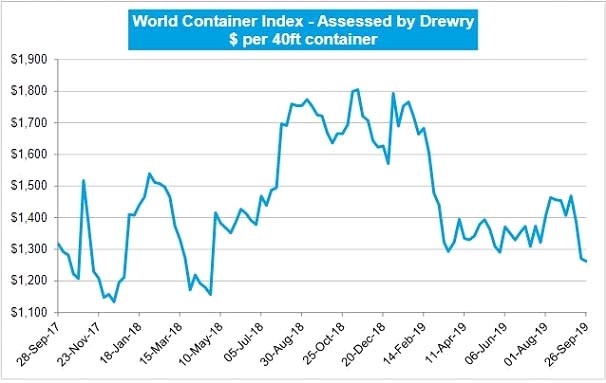
Source: Drewry
Weekly capacity changes in the services operating in the main container trades in the 3rd quarter of 2019
TEU/week
| Trade | Beginning of July2019 |
End of September
2019 |
Variation
(+) (–), % |
| Transatlantic | 145,843 | 147,420 | +1.1 |
| Transpacific services | 467,393 | 481,393 | +3.0 |
| Far East – Europe | 426,269 | 415,502 | -2.5 |
| TOTAL | 1,039,505 | 1,044,315 | +0.5 |
Source:Alphaliner
Market players’ forecasts
It is quite obvious that any kind freight index dynamics and the ensuing container shipment rates in time-charter or liner segments of the global market are, in the long run, defined by the fundamental tonnage demand and supply factors. The surge of time-charter rates for Panamax and Post-Panamax container carriers in the 3rd quarter was due to a keener deficit in tonnage of that type/size ships just shortly before the new IMO 2020 standards coming into effect as these standards toughen up the sulphur content in the marine fuels since 1 January, 2020.
According to Loadstar, the majority of operators made their choice in favour of installation of scrubbers (instead of the expensive low-sulphur fuel or LNG). To this end, the lines have to withdraw own ships from service for 25-30 days and more, and replace this tonnage by chartered ships. This situation resulted in a shortage of tonnage, excitement around the freight rates, slowdown of the container ships scrapping rate and revival of the second-hand market (sales of second hand ships). According to ALLIED Shipping Research, for the 3rd quarter of 2019 only 17 container carriers of the total deadweight 544.4 thou tons were scrapped. During the same period 30 container ships of the total deadweight 1,414.4 thou tons and total cost of USD 446.8 m have found new owners.
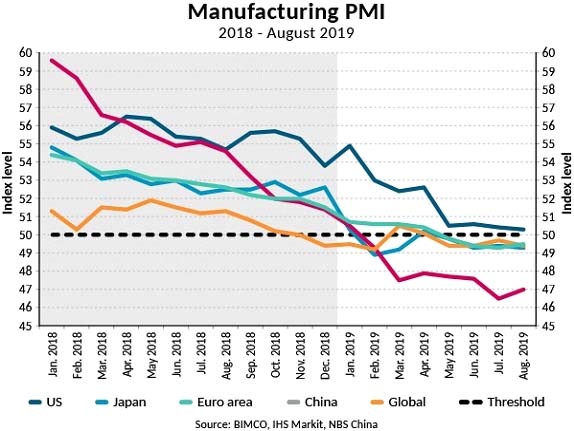
However, the temporary artificially caused deficit of tonnage in the time-charter segment in no way influenced the fundamental factor of demand for container transportation. According to the maritime analysts, the global container traffic by sea in January-August 2019 grew by 1.8% only, comprising 113.4 m TEUs. It turned to be obviously insufficient neither for supporting freight rates nor for backing the long awaited peak season by liner carriers. The IHS Market Purchasing Manager’s Index (PMI) in July comprised 49.3 points only, which has been its minimum value since October 2012. Though PMI reached 49.5 points in August, it is still lower than the 50 points level wherefrom the sound dynamics begins its count.
According to the same IHS Market data, the real GDP reduction in 2019 can be 0.8%, and reach 1.4% in 2020. It is explained by the trade wars and other negative macroeconomic processes that brought the world economy on the brink of recession. Available appraisals tell that the imposed reciprocal sanctions and duties between PRC and USA have led to the Chinese reduction of import in 2019 by 6.5% while the US export has reduced by 10%. In 2019 the IMF expects relaxation of the economic growth in 90% of world economies, which means the minimum global growth since the beginning of the current decade. Also, the IMF is of opinion that currently the international trade has, practically, stopped to grow, which goes ill with the shipping.
Dynamics of Manufacturing Purchasing Manager’s Index from January 2018 to August 2019
According to previous assessments of the WTO, the world trade growth in 2019 should have been reduced to 2.6% as compared with 3% reached in 2018. However, now the WTO forecasts the maximum growth could be 1.6% only, depending on the trade war developments.
Proceeding from the developing economic situation, the majority of maritime analysts do not see any reasons to be optimistic either in the 4th quarter of 2019 or in the 2020 on the whole. Moreover, the spot market will be as highly volatile as in the previous 9 months of 2019.
Particular concern of the BIMCO analysts is caused by the fact that during the first 7 months of 2019 the demand for the intra-Asian container traffic has grown by 0.8% only, which is a rather negative factor for the entire global market. As it was pointed out in the previous review, the Drewry analysts belittled their forecast of the container traffic growth in 2019 from 3% to 2.6%. About the same figures of demand are predicted by Clarksons analysts – 3.1% in TEU and 2.7% in TEU-miles for the global container market, including reduction by 2.8% in the trunk routes and 3.2% in all other routes.
Increase in the global container tonnage in 2015 – 2021*
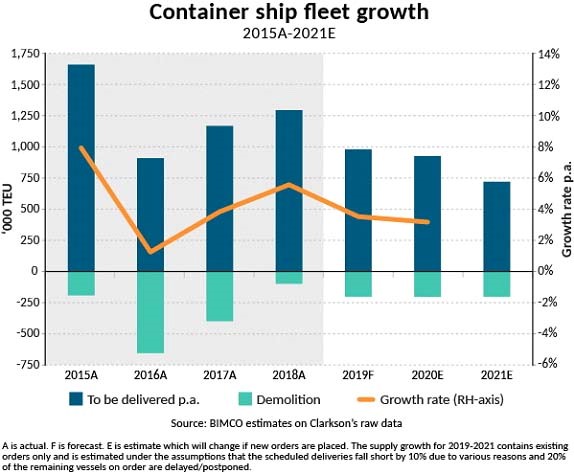
*2015-2018 – actual, 2019 – forecast, 2020-2021 – assessment
As regards the growing supply of container tonnage, Clarksons assess it at the level of 3% in 2019 and 3.3% in 2020. They also explain the lag from BIMCO forecast for 2019 (3.5%) by, approximately, 0.5% by the fact that the one third of this year increase will be levelled out by a removal of ships from service for installing scrubbers. For instance, in the mid-September 25 container carriers of the 277.6 thou TEU capacity stayed in docks because of installation of scrubbers onboard.
Alphaliner reports that as of mid-September the laid-up container carrier fleet comprised 148 ships of the 641.3 thou TEU total capacity, or 2.8% of the operated fleet. The same source also reports that altogether, as of 01.10.19, the operated container fleet comprised 6,141 ships (including 5,239 cell-type ships), the total capacity being 23,442.2 thou TEU (including 23,056.8 thou TEU or 98.4% of the cell-type ships) of the 283.8 m ton total deadweight. For 9 incomplete months of 2019, Alphaliner says, there appeared 108 new container carriers of the 826 thou TEU aggregate capacity while the demolished tonnage comprised 165 thou TEU total capacity (the ratio being 5:1).
BIMCO assess the total container tonnage replenishment in 2019 at the level of 967 thou TEU with the scrapped container ships of about 200 thou TEU (the ratio being 4.8:1).
Indicative orders for new container carriers in the 3rd quarter 2019
| Shipbuilding yard | Nbr of ships |
Container capacity,
TEU |
Ship price, mil. USD |
Delivery time,
year |
Shipowner/ operator |
| NAIKAI ZOSEN | 1 | 1,900 | n/a | 2020 | OAK SHIP |
| HUANGPU WENCHONG | 2+2 | 2,700 | 30.5 | 2021 | TS LINES |
| IMABARI | 5 | 23,000 | 155 | 2022 | SHOEI KISEN |
| SAMSUNG | 6 | 23,000 | 155 | 2022 | GREENCOMPASS |
| SAMSUNG, HUDONG-ZHONGHUA, JIANGNAN | 10 | 23,000 | 160.0 | 2022 | EVERGREEN |
Source: Intermodal, Advanced, Allied
BIMCO analysts are of the opinion that now the main problem of container industry is in a misbalance of the demand and supply because of the excessive tonnage. This being said, the shipowners still gave large orders for a new fleet (just recollect the latest Evergreen Line order for 11 container carriers of 23,000 TEU) which, by all accounts, the market did not need at all as it had already been oversaturated. Above all it refers to the ULCS container carriers of 14,500 TEU capacity and above. The active fleet has 165 ships of such class including 8 ships older than 10 years only while 78 ULCS container carriers are below 2 years old. That is, it will be long before that entire flotilla is scrapped. Writing off the container fleet in the nearest years will be limited by old ships of much less capacity, which will still exacerbate the problem. For instance, the maximum tonnage of the container carriers scrapped in January-September 2019 comprised 5,364 TEU, and the medium tonnage was just 2,142 TEU.
From all has been said, just one conclusion can be elicited: there is every likelihood that in the years to come the container industry will face a rather tough time.
Based on the maritime periodicals